
PUBLISHER: Mordor Intelligence | PRODUCT CODE: 1844547

PUBLISHER: Mordor Intelligence | PRODUCT CODE: 1844547
Wireless Occupancy Sensors - Market Share Analysis, Industry Trends & Statistics, Growth Forecasts (2025 - 2030)
The wireless occupancy sensors market size reached USD 1.1 billion in 2025 and is forecast to climb to USD 2.3 billion by 2030, advancing at a 15.9% CAGR.
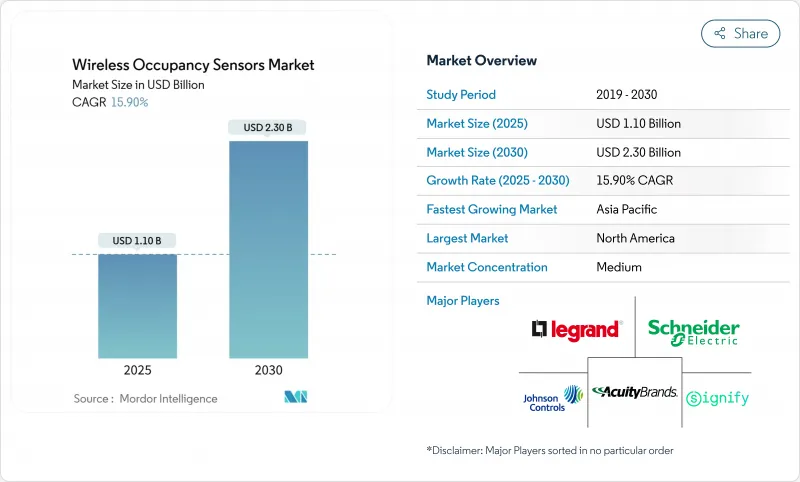
Surging investment in smart-building platforms, tightening energy-efficiency regulations, and rapid advances in battery-free energy-harvesting designs are the primary engines behind this momentum. Vendors are embedding AI-enabled sensor-fusion algorithms that cut false triggers and raise detection accuracy, while building owners value the reduced maintenance that kinetic, solar, and thermal harvesters provide. Competition is intensifying as lighting majors buy specialist sensor makers to gain data-interoperability advantages, and regional growth profiles mirror regulatory rigor-North America benefits from ASHRAE 90.1-2019 and California Title 24 requirements, whereas Asia-Pacific leverages China's intelligent-building mandate and Japan's energy-efficient IoT programs. These converging factors are creating a robust pipeline of retrofit and greenfield projects that will keep the wireless occupancy sensors market on a double-digit growth path through the decade.
Global Wireless Occupancy Sensors Market Trends and Insights
Stringent Energy-Efficiency Mandates
Energy codes such as the European Union's Energy Performance of Buildings Directive and California Title 24 require automatic lighting and HVAC controls, anchoring long-term demand for wireless occupancy sensors market solutions. New York City's Local Law 88 adds financial penalties for non-compliance, cementing a regulatory pull that transcends simple payback calculations. Manufacturers see predictable upgrade cycles every five years in the EU and every three years in several U.S. states, which encourages sustained R&D spending. The mandates also catalyze retrofits in small and midsize buildings that previously viewed automation as discretionary. Collectively, these measures add 3.2 percentage points to the forecast CAGR by accelerating project pipelines.
Rapid Smart-Building & IoT Adoption
Smart-building platforms such as Cisco Spaces and Schneider Electric EcoStruxure integrate real-time occupancy data to automate HVAC, lighting, and maintenance, transforming sensors from single-function devices into data nodes that feed enterprise analytics. Thread and Matter protocols now remove interoperability headaches, letting Bluetooth, Zigbee, and Wi-Fi devices coexist without proprietary gateways. Vendors like Aqara ship dual PIR and mmWave sensors that join Apple Home, Alexa, and Google ecosystems out of the box, widening consumer reach. These network effects drive faster adoption curves, particularly in Asia-Pacific's new commercial builds. As a result, smart-building penetration will deliver the highest driver uplift at 4.1 percentage points to the wireless occupancy sensors market CAGR.
False Triggering & Calibration Issues
Conventional PIR sensors misread HVAC drafts and temperature swings, causing lights to turn on without occupants and eroding energy-savings claims. Ultrasonic Time-of-Flight devices improve detection in such environments, but installers must fine-tune sensitivity, boosting labor costs. Dual-tech fusion reduces false positives yet doubles component count and battery drain. Premium mmWave radar remains costly and needs skilled setup unfamiliar to many electricians. Until AI-assisted auto-calibration standards mature, these technical frictions subtract 2.1 percentage points from the wireless occupancy sensors market CAGR.
Other drivers and restraints analyzed in the detailed report include:
- Battery-Free Energy-Harvesting Sensors
- Hybrid-Work Demand for Space Analytics
- Data-Privacy & Cybersecurity Concerns
For complete list of drivers and restraints, kindly check the Table Of Contents.
Segment Analysis
Passive Infrared maintained 46% share in 2024 thanks to low cost and maturity, positioning it as the volume anchor of the wireless occupancy sensors market. Dual-Tech devices that blend PIR and ultrasonic signals are projected to post a 20.5% CAGR as users demand higher precision in air-conditioned open offices. Ultrasonic standalone sensors hold the runner-up slot where stable temperatures favor sound-based motion detection. mmWave radar attracts healthcare, airport, and premium office buyers that need sub-second presence confirmation for critical lighting and HVAC decisions. Computer-vision and acoustic variants remain niche yet gain attention for people-counting accuracy in retail analytics.
Vendor roadmaps increasingly bundle AI fusion engines that learn environmental patterns to slash false positives, improving confidence in the wireless occupancy sensors market. Aqara's FP300 combines dual PIR, mmWave, temperature, humidity, and illuminance sensing to feed command data into Matter networks. Such platforms use over-the-air updates, protecting investment as algorithms evolve. While BOM costs rise, lifecycle savings from reduced callbacks justify the premium, setting the stage for larger enterprise rollouts.
Lighting Control retained 59% revenue dominance in 2024, benefiting from decades of code-driven deployment in commercial fit-outs. Yet HVAC & Ventilation is forecast to expand at a 19% CAGR, as occupancy data proves essential for right-sizing airflow to post-pandemic indoor-air-quality standards. Security & Surveillance uses sensors for alarm arming and egress path lighting, offering cross-budget synergies. The highest value accrues to Space-Utilization Analytics, where advanced counting functions enable rent optimization in premium real estate.
Honeywell's Forge Sustainability+ illustrates how occupancy-tuned HVAC can reduce fan energy by 40% while maintaining comfort, unlocking new ROI levers for the wireless occupancy sensors market size tied to energy contracts. Vendors package cloud dashboards that monetize data subscriptions beyond hardware margins. Asset-tracking overlays use the same infrastructure, giving facility managers a multi-service platform that widens TAM without extra capex.
The Wireless Occupancy Sensors Market Report is Segmented by Technology (Passive Infrared, Ultrasonic, Dual Tech, and More), Application (Lighting Control, HVAC & Ventilation, Security & Surveillance, and More), Building Type (Residential, Commercial, Industrial, and More), Network Connectivity (Zigbee, Bluetooth/BLE, and More), End-User Industry, and Geography. The Market Forecasts are Provided in Terms of Value (USD).
Geography Analysis
North America led with a 35% revenue share in 2024, powered by ASHRAE 90.1-2019 and Title 24 codes that mandate sensors in virtually all commercial projects. The United States spearheads mmWave radar R&D, with firms such as Novelda delivering ultra-wideband detectors capable of micro-motion tracking for patient-room applications Novelda. Canada's LEED-centric retrofit drive and Mexico's factory expansion sustain regional volume despite occasional trade policy uncertainties. The wireless occupancy sensors market continues to benefit from federal tax incentives for energy-efficient equipment upgrades.
Asia-Pacific is the fastest-growing territory, projected to post a 17.8% CAGR as China's smart-city blueprint and Japan's Zero-Energy-Building targets boost sensor penetration. India's 100-Smart-Cities Mission and widespread 5G rollout create fertile ground for BLE-based installations in commercial towers. South Korea leverages its electronics manufacturing capacity to shorten lead times and reduce system prices, driving adoption in local education and healthcare sectors. Abundant local component supply shields the region from global chip shortages, reinforcing the wireless occupancy sensors market growth trajectory.
Europe benefits from the Energy Performance of Buildings Directive, which enforces periodic performance audits that spur continuous retrofit cycles. Germany excels in industrial automation synergies, while the United Kingdom channels carbon-reduction funds into public-sector retrofit grants. France explores smart-grid-to-building data exchanges that pay buildings for demand-response, making sensors revenue-generating assets instead of compliance costs. GDPR steers buyers toward edge-processed solutions, favoring vendors with on-device analytics. Together, these factors embed wireless sensors as a foundational element of Europe's decarbonization roadmap.
- Legrand SA
- Schneider Electric SE
- Acuity Brands Inc.
- Eaton Corporation plc
- Leviton Manufacturing Co. Inc.
- Johnson Controls International plc
- Signify N.V.
- Lutron Electronics Co. Inc.
- Honeywell International Inc.
- General Electric Co.
- Hubbell Incorporated
- ABB Ltd.
- Siemens AG
- Texas Instruments Inc.
- Crestron Electronics Inc.
- Enlighted Inc. (Siemens)
- RAB Lighting Inc.
- Autani LLC
- PointGrab Ltd.
- Delta Electronics Inc.
Additional Benefits:
- The market estimate (ME) sheet in Excel format
- 3 months of analyst support
TABLE OF CONTENTS
1 INTRODUCTION
- 1.1 Study Assumptions and Market Definition
- 1.2 Scope of the Study
2 RESEARCH METHODOLOGY
3 EXECUTIVE SUMMARY
4 MARKET LANDSCAPE
- 4.1 Market Overview
- 4.2 Market Drivers
- 4.2.1 Stringent energy-efficiency mandates
- 4.2.2 Rapid smart-building and IoT adoption
- 4.2.3 Battery-free energy-harvesting sensors
- 4.2.4 Hybrid-work demand for space analytics
- 4.2.5 ESG-linked occupancy-based HVAC contracts
- 4.2.6 AI-enabled mmWave fusion for zero-latency detection
- 4.3 Market Restraints
- 4.3.1 False triggering and calibration issues
- 4.3.2 Data-privacy and cybersecurity concerns
- 4.3.3 RF congestion in dense IoT deployments
- 4.3.4 Battery-disposal compliance costs
- 4.4 Value / Supply-Chain Analysis
- 4.5 Regulatory Landscape
- 4.6 Technological Outlook
- 4.7 Porter's Five Forces Analysis
- 4.7.1 Threat of New Entrants
- 4.7.2 Bargaining Power of Buyers/Consumers
- 4.7.3 Bargaining Power of Suppliers
- 4.7.4 Threat of Substitute Products
- 4.7.5 Intensity of Competitive Rivalry
5 MARKET SIZE AND GROWTH FORECASTS (VALUE)
- 5.1 By Technology
- 5.1.1 Passive Infrared (PIR)
- 5.1.2 Ultrasonic
- 5.1.3 Dual Tech (PIR + Ultrasonic)
- 5.1.4 Microwave / mmWave Radar
- 5.1.5 Other Technologies
- 5.2 By Application
- 5.2.1 Lighting Control
- 5.2.2 HVAC and Ventilation
- 5.2.3 Security and Surveillance
- 5.2.4 Space-Utilization Analytics
- 5.2.5 Other Applications
- 5.3 By Building Type
- 5.3.1 Residential
- 5.3.2 Commercial
- 5.3.3 Industrial
- 5.3.4 Public and Institutional
- 5.4 By Network Connectivity
- 5.4.1 Zigbee
- 5.4.2 Bluetooth / BLE
- 5.4.3 Wi-Fi
- 5.4.4 EnOcean (Energy-Harvesting)
- 5.4.5 LoRa and Other LPWAN
- 5.5 By End-User Industry
- 5.5.1 Smart Buildings
- 5.5.2 Healthcare Facilities
- 5.5.3 Manufacturing
- 5.5.4 Aerospace and Defense
- 5.5.5 Consumer Electronics and Smart Home
- 5.5.6 Others
- 5.6 By Geography
- 5.6.1 North America
- 5.6.1.1 United States
- 5.6.1.2 Canada
- 5.6.1.3 Mexico
- 5.6.2 Europe
- 5.6.2.1 United Kingdom
- 5.6.2.2 Germany
- 5.6.2.3 France
- 5.6.2.4 Italy
- 5.6.2.5 Rest of Europe
- 5.6.3 Asia-Pacific
- 5.6.3.1 China
- 5.6.3.2 Japan
- 5.6.3.3 India
- 5.6.3.4 South Korea
- 5.6.3.5 Rest of Asia-Pacific
- 5.6.4 Middle East
- 5.6.4.1 Israel
- 5.6.4.2 Saudi Arabia
- 5.6.4.3 United Arab Emirates
- 5.6.4.4 Turkey
- 5.6.4.5 Rest of Middle East
- 5.6.5 Africa
- 5.6.5.1 South Africa
- 5.6.5.2 Egypt
- 5.6.5.3 Rest of Africa
- 5.6.6 South America
- 5.6.6.1 Brazil
- 5.6.6.2 Argentina
- 5.6.6.3 Rest of South America
- 5.6.1 North America
6 COMPETITIVE LANDSCAPE
- 6.1 Market Concentration
- 6.2 Strategic Moves
- 6.3 Market Share Analysis
- 6.4 Company Profiles (includes Global level Overview, Market level overview, Core Segments, Financials as available, Strategic Information, Market Rank/Share for key companies, Products and Services, and Recent Developments)
- 6.4.1 Legrand SA
- 6.4.2 Schneider Electric SE
- 6.4.3 Acuity Brands Inc.
- 6.4.4 Eaton Corporation plc
- 6.4.5 Leviton Manufacturing Co. Inc.
- 6.4.6 Johnson Controls International plc
- 6.4.7 Signify N.V.
- 6.4.8 Lutron Electronics Co. Inc.
- 6.4.9 Honeywell International Inc.
- 6.4.10 General Electric Co.
- 6.4.11 Hubbell Incorporated
- 6.4.12 ABB Ltd.
- 6.4.13 Siemens AG
- 6.4.14 Texas Instruments Inc.
- 6.4.15 Crestron Electronics Inc.
- 6.4.16 Enlighted Inc. (Siemens)
- 6.4.17 RAB Lighting Inc.
- 6.4.18 Autani LLC
- 6.4.19 PointGrab Ltd.
- 6.4.20 Delta Electronics Inc.
7 MARKET OPPORTUNITIES AND FUTURE OUTLOOK
- 7.1 White-space and Unmet-Need Assessment

