
PUBLISHER: Mordor Intelligence | PRODUCT CODE: 1846245

PUBLISHER: Mordor Intelligence | PRODUCT CODE: 1846245
Liquid Analytical Instrument - Market Share Analysis, Industry Trends & Statistics, Growth Forecasts (2025 - 2030)
The liquid analytical instrument market size is valued at USD 467.4 million in 2025 and is forecast to reach USD 603.1 million by 2030, reflecting a 5.23% CAGR during the period.
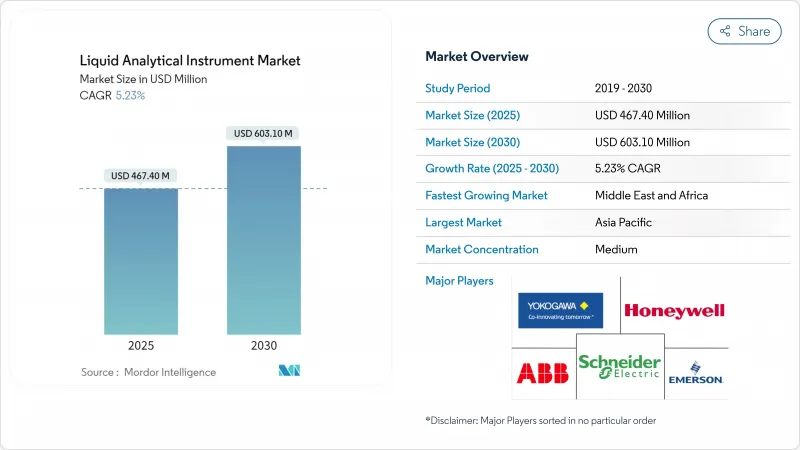
Rising compliance pressure on municipal utilities, rapid industrial automation, and a pivot toward smart sensor platforms anchor steady growth across core applications. Semiconductor fabrication, single-use bioprocessing, and green hydrogen projects demand ever-tighter water quality specifications, accelerating orders for inline pH, conductivity, and total organic carbon (TOC) analyzers. Vendors are embedding artificial intelligence into probes and controllers so that utilities can shift from scheduled checks to predictive maintenance, trimming operating expenses while meeting stricter discharge rules. Asia-Pacific leads equipment uptake on the back of aggressive capacity additions, while Middle East megaprojects for desalination and electrolysis expand the addressable base for high-salinity instruments.
Global Liquid Analytical Instrument Market Trends and Insights
Accelerating adoption of smart sensors and IIoT for real-time water quality control in municipal utilities
Utilities are replacing periodic grab sampling with continuous sensor networks that send encrypted data streams to cloud dashboards. Cincinnati's Metropolitan Sewer District raised wet-weather collection capacity by 20% and cut treatment costs by 90% after integrating pH, conductivity, and dissolved oxygen probes with an IIoT platform. Real-time alerts let operators divert flows before overflows occur, which lowers regulatory fines and insurance claims. Ruggedized instruments with built-in wireless radios therefore post stronger replacement demand than cabled legacy devices. The surge in smart sewer funding across the United States and western Europe sustains the liquid analytical instrument market as cities modernize century-old networks. Successful scale-up, however, hinges on open communication protocols that limit system integration bottlenecks.
Pharmaceutical shift to single-use bioprocessing demanding inline conductivity and TOC analytics
Continuous biologics manufacturing mandates instant confirmation that purified water meets United States Pharmacopeia and European Pharmacopoeia limits. Endress+Hauser's CA78/CA79 analyzers provide 50-second TOC readouts with UV oxidation and differential conductivity detection, giving operators immediate feedback to adjust feed streams. Inline sensors reduce downtime associated with off-line sampling while curbing cross-contamination risks in disposable bioreactors. As biopharmaceutical plants multiply across the United States, Ireland, and Singapore, suppliers of ultrapure water analyzers secure multi-year framework agreements. New probes use autodiagnostics and Smart-Verify functions to shorten validation cycles, which appeals to contract development and manufacturing organizations scaling multiple molecules. Growing regulatory scrutiny of gene and cell therapy production further boosts demand for high-accuracy, low-maintenance measurement platforms.
Skilled technician shortage inflating calibration and maintenance downtime costs
Complex analyzers require periodic multi-point calibration, diaphragm replacement, and verification against certified reference materials. Many utilities struggle to secure technicians, extending instrument downtime beyond two weeks and risking compliance breaches. A 2025 survey of 350 water operators identified workforce gaps as the top obstacle to digital transformation. Manufacturers now add self-cleaning junctions and remote-assist features, yet critical maintenance still demands on-site expertise. Downtime costs swell when batch processes halt because an inline probe fails qualification. Training programs and augmented-reality support tools only partly mitigate the constraint, leaving labor availability as a long-term drag on adoption for the liquid analytical instrument market.
Other drivers and restraints analyzed in the detailed report include:
- Tightening PFAS and micro-pollutant discharge limits
- Expansion of green hydrogen and desalination projects in Middle East
- Cross-sensitivity and fouling issues in optical DO/turbidity sensors
For complete list of drivers and restraints, kindly check the Table Of Contents.
Segment Analysis
pH and ORP analyzers held 37.8% of 2024 revenue, underlining their ubiquity across neutralization, disinfection, and chemical dosing processes. Demand persists because regulatory permits often specify discharge pH bands, and even minor deviations can corrode assets or impair biological treatment. The segment benefits from miniaturized glass-free sensors that withstand high-purity water used in microelectronics and pharmaceutical utilities. Growth moderates as most facilities already own pH loops, yet replacement cycles remain dependable given electrode aging.
Total organic carbon, chemical oxygen demand, and biological oxygen demand analyzers record the fastest 5.7% CAGR to 2030 as regulators turn to organic-load metrics for catchment-wide pollution control. Inline UV-persulfate TOC systems now deliver 30-second responses, letting operators adjust nutrient removal aeration in real time. Adoption inside clean-rooms where ultrapure water costs run high aligns with zero-liquid-discharge targets. As a result, the liquid analytical instrument market size for TOC analyzers is projected to outpace legacy parameters through 2030 while challenging traditional batch grab testing for compliance audits.
Inline analyzers contributed 54.7% revenue in 2024 as continuous monitoring became integral to distributed control strategies. These systems stream digital signals over Ethernet-APL to supervisory platforms so operators can optimize chemical dosing every few seconds. Plants running around-the-clock favor inline devices because downtime for manual sampling threatens throughput. Redundant sensor designs with hot-swap cartridges reduce maintenance windows, advancing long-term reliability.
Portable meters deliver the highest 5.2% CAGR because environmental officers and contract service crews need fast verification readings across catchments. Handheld units now pair with smartphones, using near-infrared micro-spectrometers to assess color, turbidity, and nitrate with one cuvette. Multi-parameter probes shrink kit weight for field engineers, and Bluetooth data logging supports cloud reporting. Consequently, the liquid analytical instrument market responds with rugged IP67 housings, inductive charging, and universal USB-C firmware updates that make on-site firmware refresh practical even in remote areas
The Liquid Analytical Instrument Market Report is Segmented by Measurement Parameter (pH/ORP, Conductivity, Turbidity, and More), Instrument Form Factor (In-line/On-line Analyzers, Portable/Hand-held, and More), Component (Analyzer Unit, Sensor/Probe, Display/Controller, and More), End-User Industry (Water and Wastewater Treatment, Chemicals, and More), and Geography. The Market Forecasts are Provided in Terms of Value (USD).
Geography Analysis
Asia-Pacific retained 34.2% of 2024 revenue, with China, Taiwan, and South Korea installing ultrapure water plants to feed advanced semiconductor lines. The region adds multiple 300 mm fabs annually, each requiring thousands of pH, silica, and resistivity loops to guard wafer yields. Pharmaceutical clusters in Singapore and India replicate U.S. GMP practices, installing conductivity networks that verify purified water storage in real time. Government environmental crackdowns enforce continuous monitoring across textile and electroplating parks, adding to baseline demand in the liquid analytical instrument market.
Middle East and Africa posts a 6.3% CAGR through 2030 as Saudi Arabia and United Arab Emirates mandate reverse-osmosis desalination to secure municipal supply. Electrolysis-based green hydrogen initiatives piggyback on desalination infrastructure, requiring high-salinity-tolerant sensors in shared process islands. Long pipeline distances between intake, brine outfall, and hydrogen electrolyzers necessitate distributed analytics every kilometer to meet ISO 22734 requirements. Partnerships with global vendors accelerate localization of service centers, strengthening after-sales networks in the region.
Europe maintains steady growth amid strict Union directives on micro-pollutants, while brownfield refineries and petrochemical plants upgrade to inline spectroscopy for color-number compliance. North America boosts spend on PFAS detection instruments ahead of the 2029 deadline. Latin American and African utilities face budget constraints but receive World Bank funds earmarked for leak-detection and water quality monitoring, supporting gradual modernization.
- Endress+Hauser Group
- Emerson Electric Co.
- Yokogawa Electric Corporation
- ABB Ltd.
- Hach Company (Danaher)
- Schneider Electric SE
- Honeywell International Inc.
- Mettler-Toledo International Inc.
- Teledyne Technologies Inc.
- Thermo Fisher Scientific Inc.
- Xylem Inc.
- Georg Fischer (GF) Piping Systems
- KROHNE Messtechnik GmbH
- Hanna Instruments Inc.
- Burkert Fluid Control Systems
- Horiba Ltd.
- Swan Analytical Instruments AG
- Electro-Chemical Devices Inc.
- Analytical Systems Keco Inc.
- Sensorex (Ametek)
Additional Benefits:
- The market estimate (ME) sheet in Excel format
- 3 months of analyst support
TABLE OF CONTENTS
1 INTRODUCTION
- 1.1 Study Assumptions and Market Definition
- 1.2 Scope of the Study
2 RESEARCH METHODOLOGY
3 EXECUTIVE SUMMARY
4 MARKET LANDSCAPE
- 4.1 Market Overview
- 4.2 Market Drivers
- 4.2.1 Accelerating Adoption of Smart Sensors and IIoT for Real-Time Water Quality Control in Municipal Utilities
- 4.2.2 Pharmaceutical Shift to Single-Use Bioprocessing Demanding Inline Conductivity and TOC Analytics
- 4.2.3 Tightening PFAS and Micro-Pollutant Discharge Limits in North America and EU Driving Advanced Analyzers
- 4.2.4 Expansion of Green Hydrogen and Desalination Projects in Middle East Boosting High-Salinity pH/ORP Demand
- 4.2.5 Rapid Semiconductor capacity Additions in East Asia Requiring Ultrapure Water Monitoring
- 4.2.6 Food Industry's Move to Continuous Processing Elevating Need for Hygienic, CIP-Ready Sensors
- 4.3 Market Restraints
- 4.3.1 Skilled Technician Shortage Inflating Calibration and Maintenance Downtime Costs
- 4.3.2 Cross-Sensitivity and Fouling Issues in Optical DO/Turbidity Sensors Limiting Field Reliability
- 4.3.3 Budget Freezes in Municipal Utilities of Developing Nations Slowing Replacement Cycles
- 4.3.4 Fragmented Communication Protocol Standards Hindering Plug-and-Play Integration
- 4.4 Industry Ecosystem Analysis
- 4.5 Technological Outlook
- 4.6 Porter's Five Forces Analysis
- 4.6.1 Threat of New Entrants
- 4.6.2 Bargaining Power of Buyers/Consumers
- 4.6.3 Bargaining Power of Suppliers
- 4.6.4 Threat of Substitute Products
- 4.6.5 Intensity of Competitive Rivalry
5 MARKET SIZE AND GROWTH FORECASTS (VALUES)
- 5.1 By Measurement Parameter
- 5.1.1 pH/ORP
- 5.1.2 Conductivity
- 5.1.3 Dissolved Oxygen (DO)
- 5.1.4 Turbidity
- 5.1.5 Total Organic Carbon/COD/BOD
- 5.1.6 Chlorine and Residual Chlorine
- 5.1.7 Sodium and Silicate
- 5.1.8 Nutrient Analyzers (Nitrate, Phosphate, etc.)
- 5.2 By Instrument Form Factor
- 5.2.1 In-line/On-line Analyzers
- 5.2.2 Portable/Hand-held Meters
- 5.2.3 Benchtop/Laboratory Systems
- 5.3 By Component
- 5.3.1 Analyzer Unit
- 5.3.2 Sensor/Probe
- 5.3.3 Display/Controller
- 5.3.4 Reagents and Consumables
- 5.3.5 Software and Integration Services
- 5.4 By End-User Industry
- 5.4.1 Water and Wastewater Treatment
- 5.4.2 Oil and Gas/Petrochemical
- 5.4.3 Power Generation (Thermal, Nuclear, Renewables)
- 5.4.4 Food and Beverage
- 5.4.5 Pharmaceuticals and Biotechnology
- 5.4.6 Chemicals
- 5.4.7 Pulp and Paper
- 5.4.8 Semiconductor and Electronics
- 5.4.9 Metals and Mining
- 5.4.10 Other End-User Industries (Marine, Agriculture, Academic, etc.)
- 5.5 By Geography
- 5.5.1 North America
- 5.5.1.1 United States
- 5.5.1.2 Canada
- 5.5.1.3 Mexico
- 5.5.2 Europe
- 5.5.2.1 Germany
- 5.5.2.2 United Kingdom
- 5.5.2.3 France
- 5.5.2.4 Nordics
- 5.5.2.5 Rest of Europe
- 5.5.3 South America
- 5.5.3.1 Brazil
- 5.5.3.2 Rest of South America
- 5.5.4 Asia-Pacific
- 5.5.4.1 China
- 5.5.4.2 Japan
- 5.5.4.3 India
- 5.5.4.4 South-East Asia
- 5.5.4.5 Rest of Asia-Pacific
- 5.5.5 Middle East and Africa
- 5.5.5.1 Middle East
- 5.5.5.1.1 Gulf Cooperation Council Countries
- 5.5.5.1.2 Turkey
- 5.5.5.1.3 Rest of Middle East
- 5.5.5.2 Africa
- 5.5.5.2.1 South Africa
- 5.5.5.2.2 Rest of Africa
- 5.5.1 North America
6 COMPETITIVE LANDSCAPE
- 6.1 Market Concentration
- 6.2 Strategic Moves
- 6.3 Market Share Analysis
- 6.4 Company Profiles (includes Global level Overview, Market level overview, Core Segments, Financials as available, Strategic Information, Market Rank/Share for key companies, Products and Services, and Recent Developments)
- 6.4.1 Endress+Hauser Group
- 6.4.2 Emerson Electric Co.
- 6.4.3 Yokogawa Electric Corporation
- 6.4.4 ABB Ltd.
- 6.4.5 Hach Company (Danaher)
- 6.4.6 Schneider Electric SE
- 6.4.7 Honeywell International Inc.
- 6.4.8 Mettler-Toledo International Inc.
- 6.4.9 Teledyne Technologies Inc.
- 6.4.10 Thermo Fisher Scientific Inc.
- 6.4.11 Xylem Inc.
- 6.4.12 Georg Fischer (GF) Piping Systems
- 6.4.13 KROHNE Messtechnik GmbH
- 6.4.14 Hanna Instruments Inc.
- 6.4.15 Burkert Fluid Control Systems
- 6.4.16 Horiba Ltd.
- 6.4.17 Swan Analytical Instruments AG
- 6.4.18 Electro-Chemical Devices Inc.
- 6.4.19 Analytical Systems Keco Inc.
- 6.4.20 Sensorex (Ametek)
7 MARKET OPPORTUNITIES AND FUTURE OUTLOOK
- 7.1 White-space and Unmet-Need Assessment

