
PUBLISHER: Mordor Intelligence | PRODUCT CODE: 1849870

PUBLISHER: Mordor Intelligence | PRODUCT CODE: 1849870
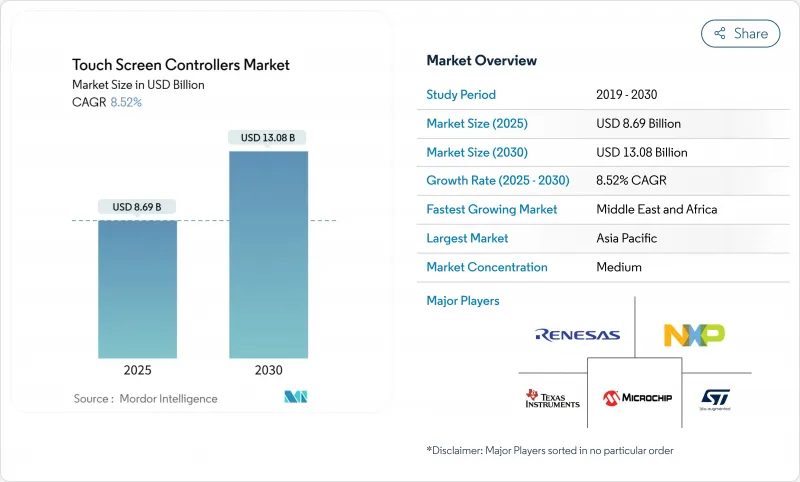
Touch Screen Controllers - Market Share Analysis, Industry Trends & Statistics, Growth Forecasts (2025 - 2030)
The touch screen controllers market size is estimated at USD 8.69 billion in 2025 and is projected to reach USD 13.08 billion by 2030, reflecting an 8.52% CAGR.
Growth is propelled by rising adoption of multi-touch interfaces in smartphones, larger in-vehicle displays, and industrial migration to projected capacitive (PCAP) panels. On the supply side, integrated touch-and-display driver ICs (TDDI) are trimming component counts and enabling thinner device profiles, while ongoing wafer-level constraints encourage premium-priced automotive and medical solutions. Demand is reinforced by retail automation, wearables that require ultra-low-power 32-bit controllers, and expanding use of flexible OLED screens that push controller algorithms toward complex edge detection and palm rejection. Regional momentum is greatest in Asia Pacific because of its dense electronics manufacturing base, with incremental opportunities building in the Middle East and Africa through smart-city projects and self-checkout deployments.
Global Touch Screen Controllers Market Trends and Insights
Multi-touch Capacitive Adoption in Flexible OLED Smartphone Displays
Smartphone makers are stretching displays over curved edges and foldable hinges, raising complexity for touch-channel routing and palm-rejection logic. Controllers must process variable pressure inputs over irregular surfaces while minimizing parasitic capacitance. Oxide-based panels showcased in 2025 demonstrated integrated touch paths that sustain signal-to-noise ratios at narrow bezels above 90% screen-to-body levels. Patent portfolios around edge shielding and localized drive waveforms create a premium tier inside the touch screen controllers market, where suppliers monetize specialized IP against high-volume flagship handsets.
In-Vehicle Infotainment Upgrades with Level-2 ADAS in Europe
Car dashboards now host curved 34-inch panels that merge cluster, navigation, and media controls. Controllers, therefore, need wide operating temperatures, stringent EMI resilience, and fault-tolerant firmware. Devices such as the ATMXT3072M1 adopt 112 reconfigurable channels and proprietary mutual-cap acquisition schemes that raise SNR by 15 dB, ensuring reliable detection under electromagnetic stress from powertrains and ADAS radars. Haptic knobs embedded atop displays restore tactile feedback, improving driver attention scores and placing additional latency constraints on the controller's scan loop.
55 nm Mixed-Signal Wafer Supply-Chain Tightness
Foundry allocations at key 55 nm nodes remain strained because automotive MCU and industrial IoT demand compete with consumer touch chips. Controller makers increasingly sign multi-year take-or-pay contracts to guarantee capacity, diverting working capital and elongating design cycles. Some firms are redesigning products for 65 nm or 40 nm bulk CMOS, though such porting introduces requalification costs and can raise die size. NXP's disclosure of limited allocation windows underscores near-term supply risk across the touch screen controllers market.
Other drivers and restraints analyzed in the detailed report include:
- Self-Checkout POS Proliferation amid North-American Labor Shortages
- Industry 4.0 Rugged PCAP Panels Replacing Membrane Keypads in China
- EMI/ESD Compliance Issues for >24" Capacitive Automotive Displays
For complete list of drivers and restraints, kindly check the Table Of Contents.
Segment Analysis
Capacitive solutions captured 71.5% of the touch screen controllers market share in 2024, reflecting strong adoption in phones, tablets, and vehicle cockpits. Their ability to sense through cover-glass and to support ten-plus touch points secures design wins where durability, optical clarity, and gesture richness matter. The segment benefits from ongoing migration to integrated TDDI chips that lower bezel count and shrink module thickness. Conversely, resistive products continue serving glove-based factory consoles and point-of-sale terminals, though incremental volumes decline as PCAP pricing falls.
Infrared controllers post the highest 10.8% CAGR to 2030. Bezel-mounted emitter-receiver arrays let integrators scale beyond 100 inches at moderate cost, a key advantage for classrooms, digital signage, and heavy-duty kiosks. Efficiency gains in IR LED drivers combined with refined line-of-sight algorithms are reducing latency and improving ambient light immunity, prompting education boards and corporate meeting rooms to consider interactive walls. This dynamic keeps technology diversity alive inside the touch screen controllers market, encouraging vendors to maintain parallel product lines across PCAP, IR, and niche acoustic or optical imaging solutions.
The I2C protocol delivered 43% revenue in 2024 thanks to its two-wire simplicity, low pin count, and multi-master capability, catering to system-on-chip environments. Smartphones, wearables, and many automotive displays rely on I2C for low-noise, low-power communication between the controller and host processor. SPI holds steady in panel PCs and higher-resolution tablets where bandwidth requirements rise, while UART persists in legacy industrial terminals seeking minimal firmware updates.
USB emerges as the fastest-growing at a 9.2% CA,GR given its plug-and-play nature and high throughput that supports stylus data and hover sensing. ODMs targeting kiosks, medical carts, and detachable monitors appreciate the standard connector and host-agnostic enumeration process. White-box PC makers also favor USB touch due to the cost avoidance of additional bridge ICs. This interface flexibility widens application reach, adds volumes to the touch screen controllers market, and pressures vendors to supply multi-interface firmware capable of seamless field reconfiguration.
The Touch Screen Controllers Market Report is Segmented by Technology (Resistive, Capacitive, and More), Interface (I2C, SPI, USB, and UART), Touch Points (Single-Touch, and Multi-Touch), Display Size (Less Than 5 Inch, 5-10 Inch, and Above 10 Inch), End-User Industry (Consumer Electronics, Industrial and Manufacturing, Retail and POS Terminals, and More), and Geography. The Market Forecasts are Provided in Terms of Value (USD).
Geography Analysis
Asia Pacific held 61.8% revenue in 2024, supported by dense component supply chains, skilled labor, and government incentives for semiconductor self-sufficiency. China hosts major controller IC fabs plus downstream module assemblers that feed local smartphone and appliance giants. Regional suppliers such as FocalTech continue to innovate with integrated display-and-touch solutions that meet automotive reliability goals focaltech-electronics.com. South Korea and Japan contribute leading OLED and oxide TFT expertise, fueling high-value controller sockets in flexible and foldable devices.
North America ranks second, driven by platform innovation in automotive electronics, medical imaging, and industrial automation. Silicon Valley design centers emphasize AI-enhanced signal processing that filters complex noise environments. Retail chains accelerate self-checkout installations, securing additional controller unit demand. Robust cybersecurity requirements in this region elevate interest in hardware-accelerated encryption embedded within touch controllers.
Europe follows closely and relies heavily on automotive production clusters in Germany, France, and Sweden. Stringent functional-safety and electromagnetic-compatibility norms lengthen design timelines yet create defendable niches for certified suppliers. EU-wide push toward Level-2 and Level-3 ADAS drives larger cockpit displays that utilize high-channel-count controllers, enriching application diversity in the touch screen controllers market.
The Middle East and Africa region posts the fastest 10.2% CAGR through 2030. Smart-city programs in Gulf economies order touch-enabled kiosks, digital signage, and payment terminals. Retail and hospitality segments adopt interactive systems that shorten service queues. Smaller domestic integrators procure controllers via global distributors, raising local design activity.
South America shows gradual expansion, with Brazil and Argentina upgrading banking ATMs and classroom technology. Currency volatility and tariff structures influence procurement cycles, yet growing smartphone penetration nourishes aftermarket demand for repair-grade touch modules. Collective regional progress broadens the geographic footprint of the touch screen controllers market, mitigating overreliance on Asia-based output.
- NXP Semiconductors
- Renesas Electronics Corporation
- Samsung Electronics Co. Ltd.
- Texas Instruments Incorporated
- Analog Devices Inc.
- STMicroelectronics
- Microchip Technology Inc.
- Cypress (Infineon Technologies AG)
- Synaptics Incorporated
- Goodix Technology Inc.
- FocalTech Systems Co. Ltd.
- MELFAS Co. Ltd.
- Elan Microelectronics Corp.
- Novatek Microelectronics Corp.
- Ilitek I-SFT Technology Inc.
- Silicon Labs
- Himax Technologies Inc.
- Semtech Corporation
- Broadcom Inc.
- PixArt Imaging Inc.
- ROHM Semiconductor
- AMS OSRAM AG
- Raydium Semiconductor Corp.
Additional Benefits:
- The market estimate (ME) sheet in Excel format
- 3 months of analyst support
TABLE OF CONTENTS
1 INTRODUCTION
- 1.1 Study Assumptions and Market Definition
- 1.2 Scope of the Study
2 RESEARCH METHODOLOGY
3 EXECUTIVE SUMMARY
4 MARKET LANDSCAPE
- 4.1 Market Overview
- 4.2 Market Drivers
- 4.2.1 Multi-Touch capacitive Adoption in Flexible OLED Smartphone Displays
- 4.2.2 In-Vehicle Infotainment Upgrades with Level-2 ADAS in Europe
- 4.2.3 Self-Checkout POS Proliferation amid North-American Labor Shortages
- 4.2.4 Hand-held Medical Imaging Devices Miniaturization
- 4.2.5 Industry 4.0 Rugged PCAP Panels Replacing Membrane Keypads in China
- 4.2.6 Touch-Enabled Smartwatch Shift Driving Low-Power 32-bit Controllers
- 4.3 Market Restraints
- 4.3.1 55 nm Mixed-Signal Wafer Supply-Chain Tightness
- 4.3.2 EMI/ESD Compliance Issues for Above 24-inch capacitive Automotive Displays
- 4.3.3 Controller-IP Litigation with Indian White-Box Tablet Makers
- 4.3.4 ASP Erosion from Panel-Maker Vertical Integration
- 4.4 Industry Ecosystem Analysis
- 4.5 Technological Outlook (Controller Architectures and Sensing Algorithms)
- 4.6 Regulatory Outlook (EMC and Automotive-Grade Standards)
- 4.7 Porter's Five Forces Analysis
- 4.7.1 Bargaining Power of Suppliers
- 4.7.2 Bargaining Power of Buyers
- 4.7.3 Threat of New Entrants
- 4.7.4 Threat of Substitute Products
- 4.7.5 Intensity of Competitive Rivalry
5 MARKET SIZE AND GROWTH FORECASTS (VALUE)
- 5.1 By Technology
- 5.1.1 Resistive
- 5.1.2 capacitive (Projected and Surface)
- 5.1.3 Surface Acoustic Wave
- 5.1.4 Infrared
- 5.1.5 Optical Imaging
- 5.2 By Interface
- 5.2.1 I2C
- 5.2.2 SPI
- 5.2.3 USB
- 5.2.4 UART
- 5.3 By Touch Points
- 5.3.1 Single-Touch
- 5.3.2 Multi-Touch
- 5.4 By Display Size
- 5.4.1 Less than 5 Inch
- 5.4.2 5 - 10 Inch
- 5.4.3 Above 10 Inch
- 5.5 By End-user Industry
- 5.5.1 Consumer Electronics
- 5.5.2 Industrial and Manufacturing
- 5.5.3 Healthcare and Medical Devices
- 5.5.4 Retail and POS Terminals
- 5.5.5 Automotive
- 5.5.6 Banking and Financial Kiosks
- 5.5.7 Others (Aviation, Education)
- 5.6 By Geography
- 5.6.1 North America
- 5.6.1.1 United States
- 5.6.1.2 Canada
- 5.6.1.3 Mexico
- 5.6.2 Europe
- 5.6.2.1 Germany
- 5.6.2.2 United Kingdom
- 5.6.2.3 France
- 5.6.2.4 Italy
- 5.6.2.5 Spain
- 5.6.2.6 Nordics (Denmark, Sweden, Norway, Finland)
- 5.6.2.7 Rest of Europe
- 5.6.3 Asia-Pacific
- 5.6.3.1 China
- 5.6.3.2 Japan
- 5.6.3.3 South Korea
- 5.6.3.4 India
- 5.6.3.5 Southeast Asia
- 5.6.3.6 Australia
- 5.6.3.7 Rest of Asia-Pacific
- 5.6.4 South America
- 5.6.4.1 Brazil
- 5.6.4.2 Argentina
- 5.6.4.3 Rest of South America
- 5.6.5 Middle East
- 5.6.5.1 Gulf Cooperation Council Countries
- 5.6.5.2 Turkey
- 5.6.5.3 Rest of Middle East
- 5.6.6 Africa
- 5.6.6.1 South Africa
- 5.6.6.2 Nigeria
- 5.6.6.3 Rest of Africa
- 5.6.1 North America
6 COMPETITIVE LANDSCAPE
- 6.1 Market Concentration
- 6.2 Strategic Moves
- 6.3 Market Share Analysis
- 6.4 Company Profiles (includes Global Overview, Market Overview, Core Segments, Financials, Strategic Information, Market Rank/Share, Products and Services, Recent Developments)
- 6.4.1 NXP Semiconductors
- 6.4.2 Renesas Electronics Corporation
- 6.4.3 Samsung Electronics Co. Ltd.
- 6.4.4 Texas Instruments Incorporated
- 6.4.5 Analog Devices Inc.
- 6.4.6 STMicroelectronics
- 6.4.7 Microchip Technology Inc.
- 6.4.8 Cypress (Infineon Technologies AG)
- 6.4.9 Synaptics Incorporated
- 6.4.10 Goodix Technology Inc.
- 6.4.11 FocalTech Systems Co. Ltd.
- 6.4.12 MELFAS Co. Ltd.
- 6.4.13 Elan Microelectronics Corp.
- 6.4.14 Novatek Microelectronics Corp.
- 6.4.15 Ilitek I-SFT Technology Inc.
- 6.4.16 Silicon Labs
- 6.4.17 Himax Technologies Inc.
- 6.4.18 Semtech Corporation
- 6.4.19 Broadcom Inc.
- 6.4.20 PixArt Imaging Inc.
- 6.4.21 ROHM Semiconductor
- 6.4.22 AMS OSRAM AG
- 6.4.23 Raydium Semiconductor Corp.
7 MARKET OPPORTUNITIES AND FUTURE OUTLOOK
- 7.1 White-Space and Unmet-Need Assessment

