
PUBLISHER: Mordor Intelligence | PRODUCT CODE: 1849909

PUBLISHER: Mordor Intelligence | PRODUCT CODE: 1849909
Orphan Drugs - Market Share Analysis, Industry Trends & Statistics, Growth Forecasts (2025 - 2030)
The orphan drugs market stood at USD 230.91 billion in 2025 and is projected to reach USD 312.53 billion by 2030, progressing at a 6.24% CAGR.
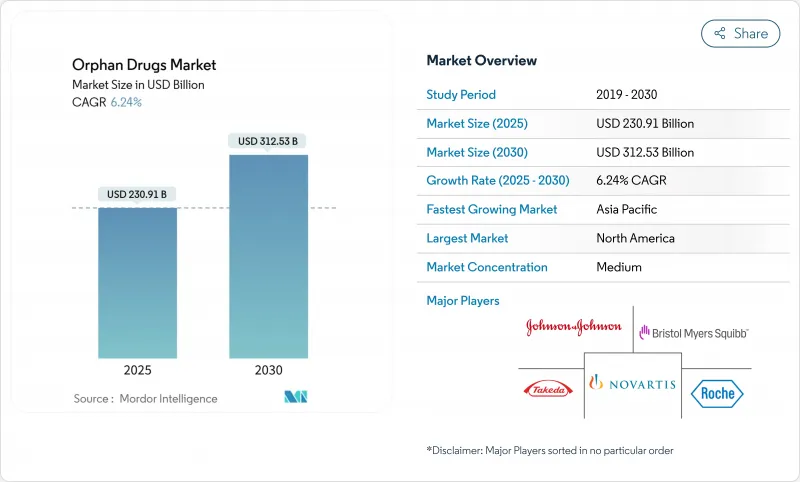
Sustained growth reflects regulatory incentives, gene- and cell-therapy breakthroughs, and persistent unmet needs across more than 7,000 rare diseases. Dominance of biologics, particularly gene therapies and monoclonal antibodies, underscores the pivot toward curative one-time treatments. North America leads on the back of robust designation programs and strong reimbursement, while Asia-Pacific gains momentum as policy frameworks expand. Competitive dynamics show large pharmaceutical firms acquiring specialty biotech innovators to secure pipeline depth, and artificial-intelligence-enabled adaptive trials are compressing development cycles to capitalize on extended exclusivity periods.
Global Orphan Drugs Market Trends and Insights
Surge in Gene & Cell-Therapy Platforms for Ultra-Rare Disorders
Gene therapy is redefining the orphan drugs market by targeting causal mutations rather than symptomatic pathways. The November 2024 FDA approval of KEBILIDI for aromatic L-amino acid decarboxylase deficiency demonstrated clinically meaningful motor improvements after a single infusion. Similar momentum appears in Europe, where LENMELDY secured EMA clearance for metachromatic leukodystrophy during 2024, validating accelerated biomarker-driven pathways. A convergence of CRISPR editing with adeno-associated virus delivery enables viable business models even when global prevalence is below 1,000 individuals. Premium pricing that can exceed USD 2 million per course underpins returns on the specialized infrastructure that manufacturers must build. Early movers with vertically integrated vector manufacturing lines attain formidable entry barriers and pricing power.
AI-Driven Adaptive Trials Shrinking Development Timelines
Artificial-intelligence platforms allow protocol adjustments based on interim efficacy and safety signals, reducing patient exposure and shaving 18-24 months off timelines relative to fixed designs. The FDA workshop on AI in 2024 clarified documentation expectations, fostering faster yet accountable pathways. Machine-learning algorithms enhance patient stratification, critical in trials where cohorts seldom exceed 200 participants. Sponsors thereby achieve regulatory-grade evidence with smaller N sizes, enabling rapid entry into the orphan drugs market ahead of exclusivity cliffs. Large firms with in-house data-science teams now dominate adaptive-trial capability, widening the competitive gap.
High Per-Patient Treatment Cost
Median annual therapy costs surpassed USD 256,000 in 2024, and single-dose gene therapies frequently exceed USD 2 million. Payers respond with prior authorization and outcomes-based contracts, especially when treatments later expand into broader populations. European HTA bodies increasingly demand post-launch evidence of durable benefit, pushing sponsors to fund long-term registries that add material expense. Pricing strategy therefore remains a delicate equilibrium between recouping innovation investment and maintaining reimbursement viability.
Other drivers and restraints analyzed in the detailed report include:
- Favorable Government Incentives & Tax Credits
- Repurposing of Shelved Phase II Assets for Niche Indications
- Payer Scrutiny on "Indication Creep"
For complete list of drivers and restraints, kindly check the Table Of Contents.
Segment Analysis
Biologics accounted for 65.65% of revenue in 2024 and will outpace small molecules at an 8.84% CAGR through 2030. Twenty-five percent of FDA approvals in 2024 were monoclonal antibodies or gene therapies, signaling sustained preference for modality platforms enabling precision interventions. The orphan drugs market size for biologics is forecast to reach USD 205 billion by 2030, buoyed by one-time curative therapies that command premium price tags. Non-biologics still retain share in metabolic disorders via repurposed small molecules, yet competitive differentiation is narrowing as genetic medicines address underlying enzymatic deficits more effectively. Manufacturers scaling viral vector plants gain cost leverage, whereas small-molecule producers rely on formulation innovation and life-cycle management to remain relevant.
Second paragraph: Gene-therapy exemplars include LYFGENIA for sickle-cell disease and KEBILIDI for aromatic L-AAD deficiency, both demonstrating transformative clinical benefit with single administrations. Manufacturing complexity elevates barrier to entry; consequently, CDMO partnerships and in-house vector capacity have become acquisition triggers. Regulatory bodies demand robust potency assays and long-term follow-up, prompting companies to establish multidisciplinary surveillance programs. Intellectual-property strategies focus on capsid engineering and promoter optimization, consolidating competitive moats within the orphan drugs market.
Oncologic diseases retained 40.53% share in 2024 but exhibit a slower growth pace as saturation in hematologic malignancies emerges. The orphan drugs market share for oncology stood at 41% in 2024 and is expected to edge marginally lower as newer categories accelerate. EMA approval of Ordspono for relapsed follicular lymphoma underscores continued innovation in T-cell-redirecting antibodies. However, hematologic and immunologic diseases are advancing at a 10.35% CAGR propelled by factor-replacement alternatives such as concizumab and fitusiran.
Second paragraph: Neurologic gene therapies, including tofersen for SOD1-ALS, broaden the pipeline and highlight biomarker-driven approvals. Metabolic disease programs leverage next-generation enzyme replacement and mRNA therapy, while infectious-disease rarities such as viral hemorrhagic fevers attract niche funding. Investors track therapeutic novelty and regulatory momentum when assessing portfolio weightings across these segments.
The Orphan Drugs Market Report is Segmented by Drug Type (Biologics and Non-Biologics), Disease Area (Oncologic Diseases, Hematologic & Immunologic Diseases, Neurologic Diseases, and More), Route of Administration (Parenteral, Oral, and More), Distribution Channel (Hospital Pharmacies, and Online Pharmacies) and Geography (North America, Europe, Asia-Pacific, and More). The Market Forecasts are Provided in Terms of Value (USD).
Geography Analysis
North America captured 42.82% of global revenue in 2024 and continues to benefit from 7-year exclusivity under the Orphan Drug Act plus the 25% clinical-trial tax credit. Recent FDA approvals of XOLREMDI for WHIM syndrome and RYT-ELO for high-risk myelodysplastic syndromes illustrate regulator responsiveness. Nonetheless, the Inflation Reduction Act introduces price-renegotiation risk if products expand beyond single orphan indications, prompting strategic caution on label extensions.
Europe holds a significant portion of the orphan drugs market on the strength of centralized EMA procedures that offer 10-year exclusivity and fee relief. The Critical Medicines Act seeks to build regional manufacturing resilience and streamline shortages, but draft reforms propose reducing regulatory-data protection to nine years, potentially tempering investment enthusiasm. Managed-entry agreements and outcome-based contracts dominate payer negotiations, ensuring access while controlling spend.
Asia-Pacific is the fastest-growing region at 11.62% CAGR to 2030, underpinned by the CARE program in China and India's rare-disease policy grants. The region's large populations ease trial recruitment, and rising disposable incomes support premium therapies. Still, fragmented reimbursement and variable epidemiological data limit immediate uptake, requiring sponsors to develop localized engagement strategies.
- Johnson & Johnson
- Novartis
- Roche
- Bristol-Myers Squibb
- Amgen
- Pfizer
- Takeda Pharmaceuticals
- Sanofi
- AstraZeneca
- Abbvie
- Alexion Pharmaceuticals Inc.
- GlaxoSmithKline
- Daiichi Sankyo Co. Ltd
- Bayer
- Vertex Pharmaceuticals Inc.
- Horizon Therapeutics
- Regeneron Pharmaceuticals
- Biomarin Pharmaceutical
- CSL Behring
- Sarepta Therapeutics
Additional Benefits:
- The market estimate (ME) sheet in Excel format
- 3 months of analyst support
TABLE OF CONTENTS
1 Introduction
- 1.1 Study Assumptions & Market Definition
- 1.2 Scope of the Study
2 Research Methodology
3 Executive Summary
4 Market Landscape
- 4.1 Market Overview
- 4.2 Market Drivers
- 4.2.1 Rising Prevalence Of Rare Diseases
- 4.2.2 Favorable Government Incentives & Tax Credits
- 4.2.3 Market Exclusivity For Orphan-Designated Drugs
- 4.2.4 Surge In Gene & Cell-Therapy Platforms For Ultra-Rare Disorders
- 4.2.5 AI-Driven Adaptive Trials Shrinking Development Timelines
- 4.2.6 Repurposing Of Shelved Phase-II Assets For Niche Indications
- 4.3 Market Restraints
- 4.3.1 High Per-Patient Treatment Cost
- 4.3.2 Limited Patient Pool For Trials & Marketing
- 4.3.3 Payer Scrutiny On Indication Creep & Real-World Value
- 4.3.4 Legislative Proposals To Shorten Exclusivity Windows
- 4.4 Porter's Five Forces
- 4.4.1 Threat of New Entrants
- 4.4.2 Bargaining Power of Buyers/Consumers
- 4.4.3 Bargaining Power of Suppliers
- 4.4.4 Threat of Substitute Products
- 4.4.5 Intensity of Competitive Rivalry
5 Market Size & Growth Forecasts (Value, USD)
- 5.1 By Drug Type
- 5.1.1 Biologics
- 5.1.2 Non-biologics
- 5.2 By Disease Area
- 5.2.1 Oncologic Diseases
- 5.2.2 Hematologic & Immunologic Diseases
- 5.2.3 Neurologic Diseases
- 5.2.4 Metabolic Diseases
- 5.2.5 Infectious Diseases
- 5.2.6 Other Rare Diseases
- 5.3 By Route of Administration
- 5.3.1 Parenteral
- 5.3.2 Oral
- 5.3.3 Others (Inhalation, Topical, Implantable)
- 5.4 By Distribution Channel
- 5.4.1 Hospital Pharmacies
- 5.4.2 Retail Pharmacies
- 5.4.3 Online Pharmacies
- 5.5 Geography
- 5.5.1 North America
- 5.5.1.1 United States
- 5.5.1.2 Canada
- 5.5.1.3 Mexico
- 5.5.2 Europe
- 5.5.2.1 Germany
- 5.5.2.2 United Kingdom
- 5.5.2.3 France
- 5.5.2.4 Italy
- 5.5.2.5 Spain
- 5.5.2.6 Rest of Europe
- 5.5.3 Asia-Pacific
- 5.5.3.1 China
- 5.5.3.2 Japan
- 5.5.3.3 India
- 5.5.3.4 South Korea
- 5.5.3.5 Australia
- 5.5.3.6 Rest of Asia-Pacific
- 5.5.4 Middle East and Africa
- 5.5.4.1 GCC
- 5.5.4.2 South Africa
- 5.5.4.3 Rest of Middle East and Africa
- 5.5.5 South America
- 5.5.5.1 Brazil
- 5.5.5.2 Argentina
- 5.5.5.3 Rest of South America
- 5.5.1 North America
6 Competitive Landscape
- 6.1 Market Concentration
- 6.2 Market Share Analysis
- 6.3 Company Profiles (includes Global level Overview, Market level overview, Core Business Segments, Financials, Headcount, Key Information, Market Rank, Market Share, Products and Services, and analysis of Recent Developments)
- 6.3.1 Johnson & Johnson
- 6.3.2 Novartis AG
- 6.3.3 F. Hoffmann-La Roche Ltd
- 6.3.4 Bristol-Myers Squibb Co.
- 6.3.5 Amgen Inc.
- 6.3.6 Pfizer Inc.
- 6.3.7 Takeda Pharmaceutical Co. Ltd
- 6.3.8 Sanofi S.A.
- 6.3.9 AstraZeneca plc
- 6.3.10 AbbVie Inc.
- 6.3.11 Alexion Pharmaceuticals Inc.
- 6.3.12 GSK plc
- 6.3.13 Daiichi Sankyo Co. Ltd
- 6.3.14 Bayer AG
- 6.3.15 Vertex Pharmaceuticals Inc.
- 6.3.16 Horizon Therapeutics plc
- 6.3.17 Regeneron Pharmaceuticals Inc.
- 6.3.18 BioMarin Pharmaceutical Inc.
- 6.3.19 CSL Behring
- 6.3.20 Sarepta Therapeutics Inc.
7 Market Opportunities & Future Outlook
- 7.1 White-space & unmet-need assessment

