
PUBLISHER: Mordor Intelligence | PRODUCT CODE: 1849919

PUBLISHER: Mordor Intelligence | PRODUCT CODE: 1849919
Service Robotics - Market Share Analysis, Industry Trends & Statistics, Growth Forecasts (2025 - 2030)
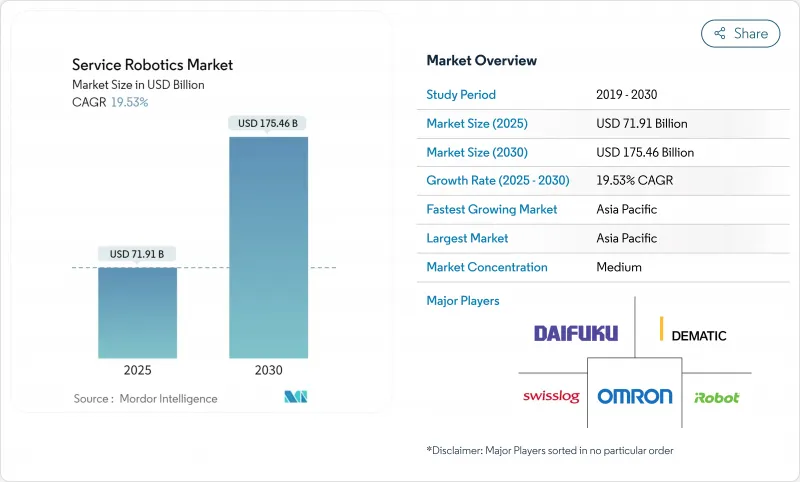
The service robotics market size reached USD 71.91 billion in 2025 and is forecast to advance to USD 175.46 billion in 2030, reflecting a 19.53% CAGR during 2025-2030.
Growth is powered by tightening labor supply in developed economies, falling robot total cost of ownership, and wider availability of Robot-as-a-Service (RaaS) plans that eliminate up-front capital hurdles. Professional deployments in logistics, healthcare, and agriculture are scaling rapidly as AI-enabled perception modules lift precision and reliability benchmarks while shortening commissioning cycles.Strategic acquisitions by large technology vendors signal a transition from discretionary automation budgets to core infrastructure spending, and regulatory clarity around collaborative operation is accelerating the shift from pilot projects to enterprise-wide rollouts. A growing pipeline of patents in assistive and mobile robotics underscores an innovation cycle that is likely to sustain double-digit expansion even through macroeconomic volatility.
Global Service Robotics Market Trends and Insights
Growing Demand for Automation in Healthcare, Logistics & Agriculture
Medical robot deliveries rose 36% in 2024 to about 6,100 units on the back of surgical precision requirements and stricter infection-control protocols. Logistics operators accelerated micro-fulfillment centre rollouts, with global installations projected to top 6,600 by 2030, creating an incremental USD 36 billion addressable pool.In agriculture, hand-eye coordinated robots are forecast to reach 35.9 million units by 2030 as growers tackle chronic labour shortages. As these three verticals anchor return-on-investment cases, the service robotics market is shifting from cost offsetting toward productivity platforms that re-shape operating models. The breadth of applications also diversifies revenue exposure, insulating suppliers against cyclical swings. Cross-learning between sectors further accelerates software reuse and component standardisation, compressing development cycles and sustaining price declines.
Rising Labour Shortages & Ageing Population
Japan anticipates an 11 million worker gap by 2040 while its over-65 cohort climbs toward 40% of the population. European healthcare faces a projected 380,000 staffing shortfall by 2025, prompting hospitals to pilot care-support robots and AI triage systems. Automation penetration stands at 36% in Europe's automotive sector versus 6% across all industries, illuminating the headroom for other verticals. Labour scarcity, therefore, underpins structural demand for the service robotics market as companies pursue resilience rather than pure cost savings. Population ageing also expands consumer-facing applications in eldercare and rehabilitation, widening the market's societal relevance. These demographic realities stretch beyond economic cycles, providing long-run visibility for investors and vendors alike.
High CAPEX & Maintenance Costs
Despite declining hardware prices, construction case studies show robots can trail conventional methods on pure cost metrics even while delivering nearly threefold productivity gains. Lifecycle uncertainties around battery replacement, sensor recalibration, and software licensing complicate budgeting for non-specialists. Mobile platforms face additional expenses for mapping and localisation, particularly where LiDAR or visual SLAM infrastructure is sparse. Many SMEs lack multi-year ROI frameworks, leading to conservative investment postures that slow penetration in price-sensitive regions. Vendors are countering by standardising components and bundling predictive-maintenance analytics, but widespread perception of upfront cost risk remains a drag on the service robotics market.
Other drivers and restraints analyzed in the detailed report include:
- Rapid AI-Sensor Convergence Lowers Robot TCO
- Robot-as-a-Service Subscriptions Unlock SME Adoption
- Safety-Cybersecurity Compliance Burden
For complete list of drivers and restraints, kindly check the Table Of Contents.
Segment Analysis
Professional service robots controlled 72% of the service robotics market in 2024, anchored by proven ROI in logistics, cleaning, and inspection assignments. Within this cohort, medical robots are set to capture the highest growth at a 23.4% CAGR to 2030, buoyed by hospital demand for minimally invasive surgery and stringent infection-control protocols. The segment benefits from expanding insurance reimbursements and growing clinical evidence that robots reduce complication rates, which collectively shortens hospital payback periods. Personal and domestic units, while smaller, continue to find adoption in floor-care and companionship roles that prime consumer familiarity with robotics.
Growing patent volumes in assistive technologies point to a widening spectrum of healthcare applications, from rehabilitation exoskeletons to AI-enabled diagnostic aides. This innovation pipeline suggests that the service robotics market size for medical subsegments could outpace the broader aggregate once regulatory bottlenecks ease. Cross-pollination between industrial and clinical development teams is also raising component commonality, helping lower costs and lifting vendor margins. Consequently, medical deployments are evolving from experimental assets into mission-critical hospital infrastructure
Hardware remained the revenue backbone with a 65.3% share of the service robotics market size in 2024. Sensors, actuators, and batteries dominate the bill of materials and still account for most cost reductions achieved via scale manufacturing. Yet, software is projected to surge at a 22.1% CAGR through 2030 as cloud runtime environments, fleet-orchestration layers, and AI inference engines become primary differentiators.
The shift mirrors enterprise IT trends where recurring licences eclipse one-time hardware margins. Vendors offering proprietary operating systems unlock stickier revenue and gather data to refine algorithms continuously. As integration complexities shrink, buyers increasingly evaluate platforms on software flexibility rather than payload capacity. Over the forecast horizon, services such as RaaS, predictive maintenance, and workflow optimisation are expected to evolve into a third value pillar that complements hardware and software in the service robotics market.
The Service Robotics Market is Segmented by Field of Application (Professional, Personal/Domestic), Component (Hardware, Software, and More), Operating Environment (Ground, Aerial / UAV, and More), Mobility (Mobile / Autonomous, Stationary / Fixed-Base), End-User Industry (Healthcare and Medical, Logistics and Warehousing, and More), and by Geography. The Market Forecasts are Provided in Terms of Value (USD).
Geography Analysis
North America held 34.5% of the global service robotics market in 2024, underpinned by mature automation infrastructure, favourable tax incentives, and robust venture funding that hit USD 6.4 billion in 2024. Enterprise users are migrating from pilot fleets to building-wide rollouts, and new RaaS models are accelerating penetration among mid-sized manufacturers. Regulatory agencies have clarified collaborative-robot safety expectations, reducing compliance ambiguity and encouraging faster procurement cycles. Public-sector demand is also materialising through defence and infrastructure modernisation initiatives that require autonomous inspection capabilities.
Asia-Pacific is projected to record the fastest 19.6% CAGR, led by China's production of 8.71 million service robots in 2024, an 18% year-on-year increase. Government policies promoting 53.3% localisation of industrial robots by 2025 provide a strong home-market platform for export expansion. Japan's service robotics industry is on course to triple by 2029 as acute labour shortages and cultural acceptance drive adoption across eldercare and hospitality. South Korean conglomerates are funneling consumer electronics expertise into low-cost domestic robots, positioning the region as both a manufacturing hub and a demand centre.
Europe accounts for a sizeable installed base but grows at a steadier pace given stringent regulatory regimes. The updated ISO 10218 and EU Medical Device Regulation increase compliance spending, yet they also set global benchmarks that European vendors leverage in export markets. Germany hosts 79% of its service-robot suppliers in professional applications and is projected to lead European service-robotics adoption by 2028. The region's competitive edge lies in high-precision engineering and functional-safety know-how, which fetches premium margins in regulated industries.
- iRobot Corporation
- Dematic Corp.
- Daifuku Co. Ltd.
- Swisslog Holding AG (KUKA)
- Omron Corporation
- SoftBank Robotics Group Corp.
- Pudu Robotics
- Boston Dynamics Inc.
- DJI Technology Co. Ltd.
- ABB Ltd.
- Seegrid Corporation
- Intuitive Surgical Inc.
- JBT Corporation
- SSI Schaefer AG
- Grenzebach GmbH
- Smith and Nephew plc
- Stryker Corporation
- Knightscope Inc.
- Kollmorgen Corporation
- Brokk AB
- Husqvarna AB
- Construction Robotics LLC
- Ecovacs Robotics
- Neato Robotics
- Transbotics Corporation
- Medtronic plc
- Northrop Grumman Corp.
- BAE Systems plc
- UBTECH Robotics Inc.
- SMP Robotics Systems
- Vision Robotics Corporation
- Naio Technologies SAS
Additional Benefits:
- The market estimate (ME) sheet in Excel format
- 3 months of analyst support
TABLE OF CONTENTS
1 INTRODUCTION
- 1.1 Study Assumptions and Market Definition
- 1.2 Scope of the Study
2 RESEARCH METHODOLOGY
3 EXECUTIVE SUMMARY
4 MARKET LANDSCAPE
- 4.1 Market Overview
- 4.2 Market Drivers
- 4.2.1 Growing demand for automation in healthcare, logistics and agriculture
- 4.2.2 Rising labour shortages and ageing population
- 4.2.3 Rapid AI-sensor convergence lowers robot TCO
- 4.2.4 Robot-as-a-Service (RaaS) subscriptions unlock SME adoption
- 4.2.5 Eldercare insurance reimbursements for assistive robots
- 4.2.6 Dark-store micro-fulfilment boom needs AMRs
- 4.3 Market Restraints
- 4.3.1 High CAPEX and maintenance costs
- 4.3.2 Safety-cybersecurity compliance burden
- 4.3.3 Lithium-battery shipping rules limit mobile robots
- 4.3.4 VC funding correction for consumer-robotics start-ups
- 4.4 Value / Supply-Chain Analysis
- 4.5 Regulatory Landscape
- 4.6 Technological Outlook
- 4.7 Porter's Five Forces
- 4.7.1 Bargaining Power of Suppliers
- 4.7.2 Bargaining Power of Consumers
- 4.7.3 Threat of New Entrants
- 4.7.4 Intensity of Competitive Rivalry
- 4.7.5 Threat of Substitutes
5 MARKET SIZE AND GROWTH FORECASTS (VALUE)
- 5.1 By Field of Application
- 5.1.1 Professional
- 5.1.1.1 Field Robots
- 5.1.1.2 Professional Cleaning
- 5.1.1.3 Inspection and Maintenance
- 5.1.1.4 Construction and Demolition
- 5.1.1.5 Logistics Systems
- 5.1.1.6 Medical Robots
- 5.1.1.7 Rescue and Security
- 5.1.1.8 Defense Robots
- 5.1.1.9 Underwater Systems
- 5.1.1.10 Powered Human Exoskeletons
- 5.1.1.11 Public-Relation Robots
- 5.1.2 Personal / Domestic
- 5.1.2.1 Domestic Task Robots
- 5.1.2.2 Entertainment Robots
- 5.1.2.3 Elderly and Handicap Assistance
- 5.1.1 Professional
- 5.2 By Component
- 5.2.1 Hardware
- 5.2.1.1 Sensors
- 5.2.1.2 Actuators
- 5.2.1.3 Controllers and Drives
- 5.2.1.4 Power Systems
- 5.2.2 Software
- 5.2.2.1 Operating Systems and Middleware
- 5.2.2.2 AI and Analytics Algorithms
- 5.2.3 Services (RaaS, Integration, Maintenance)
- 5.2.1 Hardware
- 5.3 By Operating Environment
- 5.3.1 Ground
- 5.3.2 Aerial / UAV
- 5.3.3 Marine / Underwater
- 5.4 By Mobility
- 5.4.1 Mobile / Autonomous
- 5.4.2 Stationary / Fixed-Base
- 5.5 By End-user Industry
- 5.5.1 Healthcare and Medical
- 5.5.2 Logistics and Warehousing
- 5.5.3 Agriculture
- 5.5.4 Construction and Demolition
- 5.5.5 Defense and Security
- 5.5.6 Hospitality and Retail
- 5.5.7 Education and Entertainment
- 5.6 By Geography
- 5.6.1 North America
- 5.6.1.1 United States
- 5.6.1.2 Canada
- 5.6.1.3 Mexico
- 5.6.2 South America
- 5.6.2.1 Brazil
- 5.6.2.2 Argentina
- 5.6.2.3 Rest of South America
- 5.6.3 Europe
- 5.6.3.1 Germany
- 5.6.3.2 United Kingdom
- 5.6.3.3 France
- 5.6.3.4 Italy
- 5.6.3.5 Spain
- 5.6.3.6 Russia
- 5.6.3.7 Rest of Europe
- 5.6.4 APAC
- 5.6.4.1 China
- 5.6.4.2 Japan
- 5.6.4.3 South Korea
- 5.6.4.4 India
- 5.6.4.5 Australia
- 5.6.4.6 ASEAN
- 5.6.4.7 Rest of APAC
- 5.6.5 Middle East and Africa
- 5.6.5.1 Middle East
- 5.6.5.1.1 Saudi Arabia
- 5.6.5.1.2 UAE
- 5.6.5.1.3 Turkey
- 5.6.5.1.4 Rest of Middle East
- 5.6.5.2 Africa
- 5.6.5.2.1 South Africa
- 5.6.5.2.2 Nigeria
- 5.6.5.2.3 Kenya
- 5.6.5.2.4 Rest of Africa
- 5.6.1 North America
6 COMPETITIVE LANDSCAPE
- 6.1 Market Concentration
- 6.2 Strategic Moves
- 6.3 Market Share Analysis
- 6.4 Company Profiles (includes Global level Overview, Market level overview, Core Segments, Financials as available, Strategic Information, Market Rank/Share, Products and Services, Recent Developments)
- 6.4.1 iRobot Corporation
- 6.4.2 Dematic Corp.
- 6.4.3 Daifuku Co. Ltd.
- 6.4.4 Swisslog Holding AG (KUKA)
- 6.4.5 Omron Corporation
- 6.4.6 SoftBank Robotics Group Corp.
- 6.4.7 Pudu Robotics
- 6.4.8 Boston Dynamics Inc.
- 6.4.9 DJI Technology Co. Ltd.
- 6.4.10 ABB Ltd.
- 6.4.11 Seegrid Corporation
- 6.4.12 Intuitive Surgical Inc.
- 6.4.13 JBT Corporation
- 6.4.14 SSI Schaefer AG
- 6.4.15 Grenzebach GmbH
- 6.4.16 Smith and Nephew plc
- 6.4.17 Stryker Corporation
- 6.4.18 Knightscope Inc.
- 6.4.19 Kollmorgen Corporation
- 6.4.20 Brokk AB
- 6.4.21 Husqvarna AB
- 6.4.22 Construction Robotics LLC
- 6.4.23 Ecovacs Robotics
- 6.4.24 Neato Robotics
- 6.4.25 Transbotics Corporation
- 6.4.26 Medtronic plc
- 6.4.27 Northrop Grumman Corp.
- 6.4.28 BAE Systems plc
- 6.4.29 UBTECH Robotics Inc.
- 6.4.30 SMP Robotics Systems
- 6.4.31 Vision Robotics Corporation
- 6.4.32 Naio Technologies SAS
7 MARKET OPPORTUNITIES AND FUTURE OUTLOOK
- 7.1 White-space and Unmet-need Assessment

