
PUBLISHER: Mordor Intelligence | PRODUCT CODE: 1850028

PUBLISHER: Mordor Intelligence | PRODUCT CODE: 1850028
Smart Cities - Market Share Analysis, Industry Trends & Statistics, Growth Forecasts (2025 - 2030)
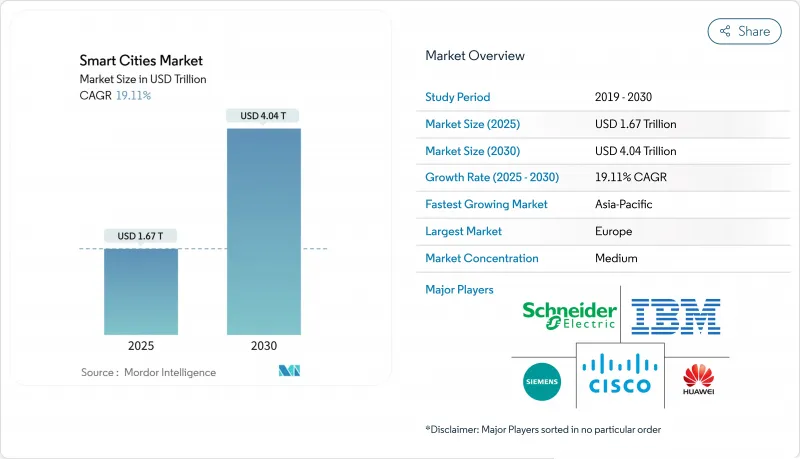
The smart cities market stood at USD 1.67 trillion in 2025 and is on course to reach USD 4.04 trillion by 2030, reflecting a 19.11% CAGR over the forecast window.
Robust government stimulus, especially the U.S. Infrastructure Investment and Jobs Act and annual Asia-Pacific allocations of USD 158 billion for urban digitization, is anchoring demand for integrated platforms that unite mobility, utilities, safety and citizen-service domains. Artificial-intelligence engines embedded in Internet-of-Things (IoT) networks have condensed municipal buying cycles to as little as eight months, accelerating time-to-value for pilot programs and enabling incremental scaling through digital twins that verify outcomes before construction. Competitive dynamics intensify as infrastructure stalwarts such as Siemens face cloud hyperscalers such as Microsoft and Oracle, following January 2025's USD 500 billion Stargate AI infrastructure announcement that signaled a multi-year race to supply compute, connectivity and applications for next-generation cities. Hardware still accounts for the largest cost block, but services are expanding faster as city leaders prefer turnkey integration and managed security contracts over piecemeal equipment purchases.
Global Smart Cities Market Trends and Insights
Surging Government Funding for Integrated Infrastructure
Infrastructure legislation is unlocking steady revenue streams for vendors. The Infrastructure Investment and Jobs Act budgets USD 100 million per year through 2026 for smart community technologies, with the first call attracting 392 municipal applications that averaged USD 1.54 million each. National engineering bodies estimate that modern digital systems can stretch asset life by as much as 30%, turning smart platforms into viable substitutes for costly concrete rebuilds. Cities like Las Vegas validated the model, saving USD 1 million annually via adaptive traffic signals that run on IoT networks. The U.S. Department of Energy's USD 51.99 billion FY 2024 budget earmarks grid modernization and clean-energy workforce programs, reinforcing city-level investment capacity. Collectively, multilevel funding reduces upfront barriers and crowds in private capital for adjacent projects across mobility, energy, and safety.
Rising Adoption of AI and IoT Platforms
National IoT strategies recommend uniform standards to fight fragmentation and accelerate cross-sector adoption. Singapore's Intelligent Transport System already cuts congestion by 35% through adaptive signal control informed by real-time analytics. Edge-computing nodes process sensor data locally, alleviating backhaul limits as the installed base of smart endpoints heads toward 500 billion by 2030. Marrying 5 G-Advanced connectivity with AIoT applications permits sub-millisecond response times essential for autonomous shuttles and predictive maintenance. These capabilities encourage holistic city platforms that interlink transport, utilities, and emergency services through one data fabric.
High Upfront Retrofit and Integration Costs
Bringing legacy buildings up to smart readiness inflates capital outlays by 15-25% versus new construction, particularly when adding vehicle-charging infrastructure to multi-family units. Academic studies discuss a "5R" retrofit framework: re-inhabitation, rebuilding, re-transportation, re-capitalisation, and re-greening that spreads costs across multiple asset classes but complicates municipal budgeting. Semiconductor shortages have raised IoT component prices by roughly 30% since 2024, a trend confirmed by federal supply-chain reviews highlighting geopolitical and climate-related risks. Repurposing brownfield sites such as a former Maine paper mill into advanced-materials plants shows cost-saving potential, yet integration tasks still demand premium expertise that many city IT teams lack. Projects that attempted piecemeal procurement report 40-60% overruns due to unforeseen interoperability issues.
Other drivers and restraints analyzed in the detailed report include:
- Energy-Positive District Pilots Accelerating Utilities Spend
- Digital-Twin Adoption Shortening Procurement Cycles
- Cyber-Security and Data-Privacy Concerns
For complete list of drivers and restraints, kindly check the Table Of Contents.
Segment Analysis
Smart mobility management secured 18.2% of 2024 revenue, making it the largest single solution line in the smart cities market. Singapore's adaptive-signal network, for example, has cut travel times and underpinned exportable best practices for data-driven congestion management. The smart cities market size associated with utilities is projected to grow fastest at a 19.2% CAGR due to energy-positive district ambitions in Europe and emerging microgrid pilots in North America. Smart safety, building automation and healthcare capture steady allocations as authorities integrate AI-video, HVAC optimisation and telehealth into consolidated command platforms.
Integration across solutions is rising: mobility data feeds energy demand forecasting, while public-safety sensors double as environmental monitors. Cities experimenting with blockchain-validated identities reduce latency in inter-agency collaboration, bolstering adoption of unified data fabrics. Although environmental monitoring and waste-collection tools grow more slowly, zero-waste mandates and circular-economy policies promise renewed interest by the decade's end.
Hardware retained 42.5% of 2024 spending, reflecting the sensor, gateway, and edge-compute foundation of any urban IoT installation. Yet services are advancing at a 19.7% CAGR as mayors seek turnkey integration to de-risk complex rollouts. The smart cities market share tilted toward services will widen as cyber assessments, data governance, and managed cloud operations become non-negotiable line items.
Supply-chain volatility continues to lift component costs, reinforcing subscription models where vendors amortise hardware over multi-year contracts. Software platforms that run predictive analytics and digital twins sustain steady demand, but differentiation shifts to vertical expertise and open-API toolkits rather than generic dashboards. Vendors able to certify interoperability across lighting, mobility, and grid protocols win premium pricing.
Smart City Market Report is Segmented by Solution (Smart Mobility Management, Smart Public Safety, and More), Component (Hardware, Software, and Services), Deployment Model (Cloud and On-Premises), End-User (Government and Municipal, Residential, and More), and by Geography. The Market Forecasts are Provided in Terms of Value (USD).
Geography Analysis
Asia-Pacific contributed 31.7% of 2024 revenue and will keep the lead with a 20.3% CAGR through 2030, as China supports nearly 800 pilot cities and India draws trilateral funding from the United States, Japan, and South Korea. Japan's Society 5.0 policy merges robotics and AI into regional revitalisation plans, using cost-sharing schemes where indirect beneficiaries such as retailers help fund mobility services. The Asia Smart City Conference underscores a regional pivot toward zero-carbon ports and hydrogen corridors that blend economic growth with decarbonisation goals.
North America continues to scale projects on the back of USD 100 million annual federal grants and aggressive private 5G build-outs. Las Vegas' data-driven policing initiative, which cut wrong-way driving by 90%, serves as a North American reference case for outcome-based procurement. The Stargate fund deepens the technology stack, promising 100,000 new jobs and vast compute capacity for AI-heavy municipal workloads.
Europe positions sustainability at the forefront, aiming for 100 Positive Energy Districts by 2025 under EU programs that marry energy surplus targets with stringent privacy laws. Syn.ikia pilots confirm 40-60% efficiency gains achievable through digital-twin-led design. Private-equity commitments such as PATRIZIA's EUR 14 billion smart-city fund validate investor confidence in long-run cash flows from green retrofits and urban-service platforms. Middle East programs emphasise autonomous mobility and e-government, with Dubai aiming for 25% self-driving journeys by 2030. Africa and South America present emerging opportunities, although fiscal constraints and skills shortages temper deployment speed.
- ABB Ltd.
- Cisco Systems Inc.
- Emerson Electric Co.
- IBM Corporation
- Ericsson AB
- Schneider Electric SE
- General Electric Co.
- Siemens AG
- Huawei Technologies Co. Ltd.
- Honeywell International Inc.
- Hitachi Ltd.
- Nokia Corporation
- Koninklijke Philips NV
- Microsoft Corporation
- Oracle Corporation
- ATandT Inc.
- Intel Corporation
- NEC Corporation
- Bosch Security Systems
- Samsung Electronics Co., Ltd.
- Panasonic Corporation
- Verizon Communications Inc.
- Alibaba Group (AliCloud)
- Johnson Controls International plc
- SUEZ SA
- Thales Group
Additional Benefits:
- The market estimate (ME) sheet in Excel format
- 3 months of analyst support
TABLE OF CONTENTS
1 INTRODUCTION
- 1.1 Study Assumptions and Market Definition
- 1.2 Scope of the Study
2 RESEARCH METHODOLOGY
3 EXECUTIVE SUMMARY
4 MARKET LANDSCAPE
- 4.1 Market Overview
- 4.2 Market Drivers
- 4.2.1 Surging government funding for integrated infrastructure
- 4.2.2 Rising adoption of AI and IoT platforms
- 4.2.3 Energy-positive district pilots accelerating utilities spend
- 4.2.4 Digital-twin adoption shortening municipal procurement cycles
- 4.2.5 Private-CBRS 5G spectrum deployments in U.S. cities
- 4.2.6 Climate-resilience mandates (flood sensors, heat-risk dashboards)
- 4.3 Market Restraints
- 4.3.1 High upfront retrofit and integration costs
- 4.3.2 Cyber-security and data-privacy concerns
- 4.3.3 Fragmented procurement and interoperability standards
- 4.3.4 Municipal debt-ceiling pressure post-COVID
- 4.4 Supply-Chain Analysis
- 4.5 Regulatory Landscape
- 4.6 Technological Outlook
- 4.7 Porter's Five Force Analysis
- 4.7.1 Bargaining Power of Suppliers
- 4.7.2 Bargaining Power of Buyers
- 4.7.3 Threat of New Entrants
- 4.7.4 Threat of Substitutes
- 4.7.5 Intensity of Competitive Rivalry
- 4.8 Assessment of Macroeconomic Trends on the Market
5 MARKET SIZE AND GROWTH FORECASTS (VALUE)
- 5.1 By Solution
- 5.1.1 Smart Mobility Management
- 5.1.2 Smart Public Safety
- 5.1.3 Smart Healthcare
- 5.1.4 Smart Building
- 5.1.5 Smart Utilities
- 5.1.6 Smart Security
- 5.1.7 Others
- 5.2 By Component
- 5.2.1 Hardware
- 5.2.2 Software
- 5.2.3 Services
- 5.3 By Deployment Model
- 5.3.1 Cloud
- 5.3.2 On-premise
- 5.4 By End-user
- 5.4.1 Government and Municipal
- 5.4.2 Residential
- 5.4.3 Commercial and Industrial
- 5.4.4 Transportation and Logistics
- 5.4.5 Utilities Providers
- 5.4.6 Other
- 5.5 By Geography
- 5.5.1 North America
- 5.5.1.1 United States
- 5.5.1.2 Canada
- 5.5.1.3 Mexico
- 5.5.2 South America
- 5.5.2.1 Brazil
- 5.5.2.2 Argentina
- 5.5.2.3 Rest of South America
- 5.5.3 Europe
- 5.5.3.1 United Kingdom
- 5.5.3.2 Germany
- 5.5.3.3 France
- 5.5.3.4 Sweden
- 5.5.3.5 Rest of Europe
- 5.5.4 Asia-Pacific
- 5.5.4.1 China
- 5.5.4.2 Japan
- 5.5.4.3 India
- 5.5.4.4 Australia
- 5.5.4.5 South Korea
- 5.5.4.6 Rest of Asia-Pacific
- 5.5.5 Middle East and Africa
- 5.5.5.1 Saudi Arabia
- 5.5.5.2 United Arab Emirates
- 5.5.5.3 Turkey
- 5.5.5.4 South Africa
- 5.5.5.5 Rest of Middle East and Africa
- 5.5.1 North America
6 COMPETITIVE LANDSCAPE
- 6.1 Market Concentration
- 6.2 Strategic Moves
- 6.3 Market Share Analysis
- 6.4 Company Profiles (includes Global level Overview, Market level overview, Core Segments, Financials as available, Strategic Information, Market Rank/Share for key companies, Products and Services, and Recent Developments)
- 6.4.1 ABB Ltd.
- 6.4.2 Cisco Systems Inc.
- 6.4.3 Emerson Electric Co.
- 6.4.4 IBM Corporation
- 6.4.5 Ericsson AB
- 6.4.6 Schneider Electric SE
- 6.4.7 General Electric Co.
- 6.4.8 Siemens AG
- 6.4.9 Huawei Technologies Co. Ltd.
- 6.4.10 Honeywell International Inc.
- 6.4.11 Hitachi Ltd.
- 6.4.12 Nokia Corporation
- 6.4.13 Koninklijke Philips NV
- 6.4.14 Microsoft Corporation
- 6.4.15 Oracle Corporation
- 6.4.16 ATandT Inc.
- 6.4.17 Intel Corporation
- 6.4.18 NEC Corporation
- 6.4.19 Bosch Security Systems
- 6.4.20 Samsung Electronics Co., Ltd.
- 6.4.21 Panasonic Corporation
- 6.4.22 Verizon Communications Inc.
- 6.4.23 Alibaba Group (AliCloud)
- 6.4.24 Johnson Controls International plc
- 6.4.25 SUEZ SA
- 6.4.26 Thales Group
7 MARKET OPPORTUNITIES AND FUTURE OUTLOOK
- 7.1 White-space and Unmet-need Assessment

