
PUBLISHER: Mordor Intelligence | PRODUCT CODE: 1850070

PUBLISHER: Mordor Intelligence | PRODUCT CODE: 1850070
Control Valve - Market Share Analysis, Industry Trends & Statistics, Growth Forecasts (2025 - 2030)
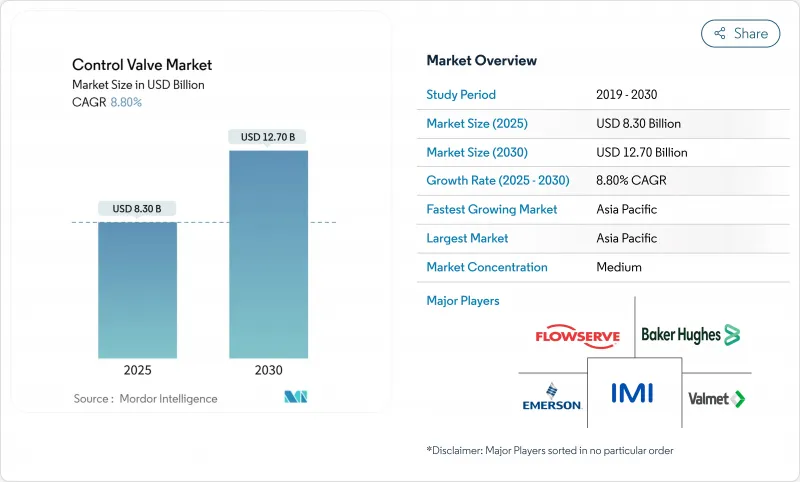
The control valve market size stands at USD 8.30 billion in 2025 and is projected to reach USD 12.70 billion by 2030, advancing at an 8.80% CAGR.
Steady capital spending in oil, gas, power, and water infrastructure underpins this growth while the scale-up of the hydrogen economy and digitalized asset management create fresh application pockets. Nearly USD 1.06 trillion to USD 1.34 trillion in oil and gas infrastructure investment forecast through 2035 secures a long-range demand floor. Municipal water authorities add structural tailwinds; Los Angeles Department of Water and Power alone is executing a USD 6.3 billion, five-year capital program that prioritizes valve upgrades in transmission mains and treatment plants. Regulatory momentum accelerates the transition from pneumatic to electric actuation as the U.S. Environmental Protection Agency's methane charge of USD 900 per metric ton raises the cost of fugitive emissions compliance. APAC, with 38.2% of 2024 revenue, anchors global volume while North America and Europe lead in digital retrofits and severe-service specifications.
Global Control Valve Market Trends and Insights
Rising investments in water & wastewater infrastructure
Municipal utilities are prioritizing asset renewal to meet tightening quality mandates and climate resilience targets. Tennessee's 2024 grants of USD 232 million for 102 projects illustrate the breadth of replacement programs where electronically actuated valves deliver the remote-monitoring functionality operators now require. Parallel spending in California's largest water district underpins a multi-year procurement cycle for smart butterfly and plug valves that reduce non-revenue water losses. These commitments underpin the electric actuation growth trajectory while stimulating aftermarket services tied to diagnostics software.
Modernisation of aging power & process plants
Decarbonization roadmaps at thermal, nuclear, and petrochemical sites compress replacement cycles for legacy flow-control assets. The U.S. Department of Energy's Nuclear Power Plant Modernization Strategy identifies control valve upgrades as a foundational safety investment and allocates research funding to digital positioners qualified for nuclear service. Hydropower life-extension programs channel nearly USD 1 billion toward modern electronic valves that integrate cybersecurity safeguards for supervisory control networks energy.gov. These projects shift specification toward high-accuracy globe designs and corrosion-resistant alloys, reinforcing premium pricing niches.
Oil-price volatility curbing O&G CAPEX
Commodity swings dampen exploration appetite, deferring greenfield pipeline and LNG projects that rely heavily on high-value valves. Australian Energy Producers note that the country attracted only 1.2% of global exploration spending over five years, underscoring a conservative investment climate . PETRONAS' 2025-2027 outlook echoes this caution, emphasizing brownfield optimization over capacity expansion. While baseline maintenance keeps the installed base active, short-cycle discretionary spending remains at risk until pricing visibility improves.
Other drivers and restraints analyzed in the detailed report include:
- Stringent environmental regulations on emissions
- Hydrogen economy scale-up requiring high-pressure valves
- Pricing pressure from low-cost Asian suppliers
For complete list of drivers and restraints, kindly check the Table Of Contents.
Segment Analysis
Globe valves held a 32% control valve market share in 2024, reflecting their fine throttling capability in refineries, chemical reactors, and high-pressure steam loops. Their installed base drives a substantial aftermarket that favors OEM spare parts, reinforcing stickiness in the control valve market. Ball valves, preferred for tight shut-off, represent the second-largest slice of the control valve market size and sustain demand from pipeline loop-isolation duties. Butterfly valves register the fastest 8.9% CAGR thanks to compact build, lower cost per diameter, and enhanced sealing profiles that extend their use into moderately critical service. Digital positioners embedded on globe and butterfly bodies illustrate the growing convergence of mechanical design with electronics. Plug and diaphragm valves retain niche relevance in slurry and sanitary duties respectively, supported by application-specific materials such as Hastelloy or USP-grade fluoroplastics.
Lifecycle economics tilt in favor of severe-service globe designs with hard-faced trims that triple mean-time-between-maintenance versus commodity units. Concurrently, water utilities choose resilient-seated butterfly valves to optimize capital budgets, continuing to stretch the control valve market beyond process industries. Suppliers differentiate via additive-manufactured trims that handle cavitation and flashing, extending penetration in desalination and geothermal plants. As energy transition projects integrate hydrogen and carbon-capture processes, metal-seated ball valves qualified to API 6A emerge as a vital growth pocket.
Pneumatic units retained a 48% control valve market share in 2024 because intrinsic safety and torque density remain essential in hydrocarbon processing. Their relatively simple maintenance profile underpins a robust spares ecosystem that tempers migration to electrics. However, electric drives are forecast to compound at 9.8% through 2030, supported by zero-emission operation, expanding torque ratings, and the appeal of integrated diagnostics that slot directly into plant Ethernet architectures. This dynamic is reshaping the control valve market size for drives, shifting revenue from compressors and air dryers toward software-enabled condition monitoring modules.
Hydraulic actuation sustains a limited but strategic footprint in subsea and heavy mining where fail-safe spring packages or battery-backed electrics fall short. Manual gearboxes persist in low-duty cycles but are increasingly paired with position feedback sensors to satisfy cybersecurity-driven asset-visibility mandates. As cloud-native historians refine anomaly detection, electric drives with embedded processors can execute local edge analytics, improving loop tuning and lowering mean time to repair. Vendors offering common control boards across electric, pneumatic, and hydraulic lines gain supply-chain economies while simplifying user training.
Control Valve Market Segmented by Type (Globe, Ball, Butterfly and More), End-User Industry (Oil and Gas, Chemical, Petrochemical, and Fertilizer, and More), Actuation Technology (Pneumatic, Hydraulic and More), Material (Steel, Cast Iron and More), and by Geography. The Market Forecasts are Provided in Terms of Value (USD).
Geography Analysis
APAC, representing 38.2% of 2024 sales, combines unmatched volume with the fastest 7.9% CAGR through 2030. Large-scale petrochemical complexes on China's eastern seaboard and India's USD 2.4 billion national hydrogen mission translate directly into high-pressure globe and ball valve procurement. Southeast Asian LNG expansion reinforces baseline demand, while state-owned utilities in Indonesia and Vietnam capitalize on multilateral financing to modernize water treatment, sustaining a balanced valve mix.
North America remains an innovation nucleus where stringent emission rules, digital retrofits, and SMR pilots drive premium product adoption. The American Petroleum Institute expects USD 1.06 trillion to USD 1.34 trillion in oil and gas infrastructure investment through 2035, anchoring pipeline valve volumes. Infrastructure renewal programs such as Los Angeles' five-year USD 6.3 billion water initiative feed consistent aftermarket revenue for smart butterfly and plug valves.
Europe positions environmental compliance at the forefront, accelerating electrification of actuation and favoring low-leakage stem-seal systems. Nuclear life-extension projects in France and the United Kingdom contribute to severe-service valve demand, while Germany's green hydrogen corridors specify stainless valves with hydrogen permeation barriers. The Middle East and Africa leverage hydrocarbon cash flows to fund desalination and solar-powered water projects, adopting corrosion-resistant duplex butterfly valves. Latin America, though smaller, benefits from copper mining CAPEX in Chile and Peru where high-pressure slurry valves offset cyclical volatility in oil revenues.
- Emerson Electric Co.
- Flowserve Corporation
- Baker Hughes Co. (Cameron)
- Valmet (Metso)
- IMI plc
- CIRCOR International Inc.
- Christian Brkert GmbH
- Crane Co. Nuclear Division
- Neway Valve (Suzhou) Co. Ltd
- ABB Ltd
- Alfa Laval AB
- Rotork plc
- AUMA Riester GmbH
- Crane Co.
- SAMSON AG
- KSB SE and Co. KGaA
- AVK Holding A/S
- Cla-Val Co.
- Velan Inc
- Spirax-Sarco Engineering plc
Additional Benefits:
- The market estimate (ME) sheet in Excel format
- 3 months of analyst support
TABLE OF CONTENTS
1 INTRODUCTION
- 1.1 Study Assumptions and Market Definition
- 1.2 Scope of the Study
2 RESEARCH METHODOLOGY
3 EXECUTIVE SUMMARY
4 MARKET LANDSCAPE
- 4.1 Market Overview
- 4.2 Market Drivers
- 4.2.1 Rising investments in water and waste-water infrastructure
- 4.2.2 Modernisation of aging power and process plants
- 4.2.3 Stringent environmental regulations on emissions
- 4.2.4 Hydrogen economy scale-up requiring high-pressure valves
- 4.2.5 Digital-twin enabled predictive valve diagnostics
- 4.2.6 Growth of SMRs demanding severe-service valves
- 4.3 Market Restraints
- 4.3.1 Oil-price volatility curbing Oil and Gas CAPEX
- 4.3.2 Pricing pressure from low-cost Asian suppliers
- 4.3.3 Alloy supply-chain disruptions
- 4.3.4 Cyber-security risks in smart positioners
- 4.4 Value / Supply-Chain Analysis
- 4.5 Regulatory Landscape
- 4.6 Technological Outlook
- 4.7 Porter's Five Forces Analysis
- 4.7.1 Bargaining Power of Suppliers
- 4.7.2 Bargaining Power of Buyers
- 4.7.3 Threat of New Entrants
- 4.7.4 Threat of Substitutes
- 4.7.5 Intensity of Competitive Rivalry
- 4.8 Investment Analysis
5 MARKET SIZE AND GROWTH FORECASTS (VALUE)
- 5.1 By Valve Type
- 5.1.1 Globe
- 5.1.2 Ball
- 5.1.3 Butterfly
- 5.1.4 Plug
- 5.1.5 Diaphragm
- 5.1.6 Other Valve Types
- 5.2 By Actuation Technology
- 5.2.1 Pneumatic
- 5.2.2 Hydraulic
- 5.2.3 Electric
- 5.2.4 Manual
- 5.3 By End-user Industry
- 5.3.1 Oil and Gas
- 5.3.2 Chemical, Petrochemical and Fertilizer
- 5.3.3 Energy and Power
- 5.3.4 Water and Waste-water Treatment
- 5.3.5 Metal and Mining
- 5.3.6 Food and Beverage
- 5.3.7 Pharmaceutical
- 5.3.8 Pulp and Paper
- 5.3.9 Other Industries
- 5.4 By Material
- 5.4.1 Steel
- 5.4.2 Cast Iron
- 5.4.3 Alloy-based
- 5.4.4 Plastic (PVC, PP, PVDF)
- 5.4.5 Other Materials
- 5.5 By Geography
- 5.5.1 North America
- 5.5.1.1 United States
- 5.5.1.2 Canada
- 5.5.1.3 Mexico
- 5.5.2 South America
- 5.5.2.1 Brazil
- 5.5.2.2 Argentina
- 5.5.2.3 Rest of South America
- 5.5.3 Europe
- 5.5.3.1 United Kingdom
- 5.5.3.2 Germany
- 5.5.3.3 France
- 5.5.3.4 Italy
- 5.5.3.5 Spain
- 5.5.3.6 Russia
- 5.5.3.7 Rest of Europe
- 5.5.4 APAC
- 5.5.4.1 China
- 5.5.4.2 Japan
- 5.5.4.3 South Korea
- 5.5.4.4 India
- 5.5.4.5 Australia
- 5.5.4.6 Rest of APAC
- 5.5.5 Middle East and Africa
- 5.5.5.1 GCC
- 5.5.5.2 South Africa
- 5.5.5.3 Rest of Middle East and Africa
- 5.5.1 North America
6 COMPETITIVE LANDSCAPE
- 6.1 Market Concentration
- 6.2 Strategic Moves
- 6.3 Market Share Analysis
- 6.4 Company Profiles (includes Global level Overview, Market level overview, Core Segments, Financials as available, Strategic Information, Market Rank/Share for key companies, Products and Services, and Recent Developments)
- 6.4.1 Emerson Electric Co.
- 6.4.2 Flowserve Corporation
- 6.4.3 Baker Hughes Co. (Cameron)
- 6.4.4 Valmet (Metso)
- 6.4.5 IMI plc
- 6.4.6 CIRCOR International Inc.
- 6.4.7 Christian Brkert GmbH
- 6.4.8 Crane Co. Nuclear Division
- 6.4.9 Neway Valve (Suzhou) Co. Ltd
- 6.4.10 ABB Ltd
- 6.4.11 Alfa Laval AB
- 6.4.12 Rotork plc
- 6.4.13 AUMA Riester GmbH
- 6.4.14 Crane Co.
- 6.4.15 SAMSON AG
- 6.4.16 KSB SE and Co. KGaA
- 6.4.17 AVK Holding A/S
- 6.4.18 Cla-Val Co.
- 6.4.19 Velan Inc
- 6.4.20 Spirax-Sarco Engineering plc
7 MARKET OPPORTUNITIES AND FUTURE OUTLOOK
- 7.1 White-space and Unmet-need Assessment

