
PUBLISHER: Mordor Intelligence | PRODUCT CODE: 1850082

PUBLISHER: Mordor Intelligence | PRODUCT CODE: 1850082
VaaS - Market Share Analysis, Industry Trends & Statistics, Growth Forecasts (2025 - 2030)
The video as a service market stood at USD 7.5 billion in 2024 and is projected to reach USD 14.49 billion by 2030, advancing at a 14.1% CAGR between 2025 and 2030.
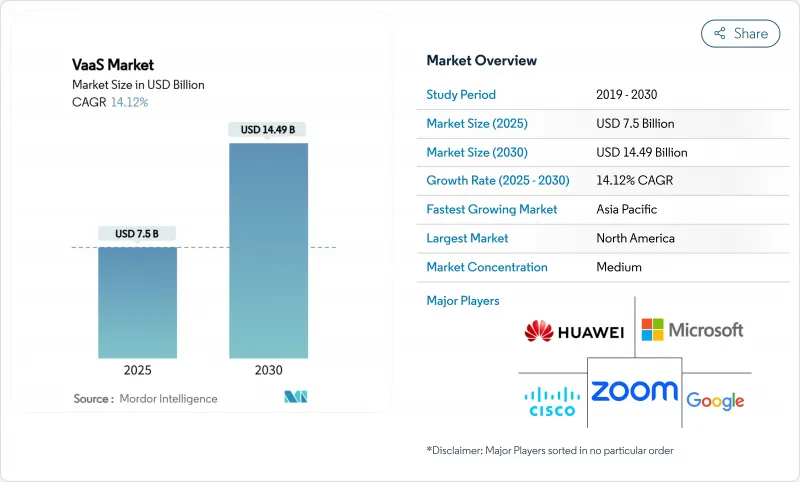
Stable cloud bandwidth pricing, deeper 5G penetration, and buyers' preference for subscription billing over capital investment continue to widen adoption. Finance chiefs increasingly tag cloud video spending as a predictable operating cost, which smooths cash flows even when IT budgets tighten. Asia-Pacific is accelerating on the back of new data-centre capacity and extensive 5G standalone roll-outs. Investors reward vendors that pair recurring revenue with compliance-ready features, prompting road maps that emphasise encryption, audit logging, and sovereign deployment templates. Heightened carbon-reduction mandates and hybrid-work retrofit programmes extend demand into facilities budgets, further reinforcing the video as a service market trajectory.
Global VaaS Market Trends and Insights
Shift from Capital Expenditure to Operating Expenditure
Enterprises redirected budgets from proprietary bridges to pay-per-use cloud video throughout 2024. A tier-one US telco reported that moving one-quarter of its video portfolio to a service model cut annual depreciation by double digits and lifted operating free cash flow. Depreciation relief often funds bandwidth upgrades, forming a self-reinforcing flywheel that multiplies usage. Finance units appreciate monthly fee visibility, which cushions VaaS spending during macro headwinds. Vendors respond by simplifying per-user licensing tiers, reducing procurement complexity. Early adopters confirm that the switch trims lifecycle support overhead because cloud platforms absorb version management.
Embedded Video APIs in Customer Applications
A European insurer distributed 40,000 personalised renewal videos in 2025 using an API gateway that pulls real-time policy data into templated scenes. Marketing departments, now direct stakeholders, accelerate purchase cycles that were previously IT-led. Integration of customer relationship management data inside video accelerates retention campaigns and supports dynamic upsell prompts. As API maturity grows, insurers embed consent capture and click-through next to playback, tightening compliance loops. This approach also shrinks hosting costs because content length can be tailored to policy complexity, reducing storage minutes per customer while boosting engagement.
Sovereign Data-Residency Requirements
An Australian banking group migrated all meeting recordings to a locally hosted instance in 2025 to align with updated prudential standards. Geo-fenced traffic routing fragments support operations and raise tooling needs for cross-region monitoring. Vendors must maintain compliance templates for multiple jurisdictions, increasing engineering overhead. Negotiating data-processing agreements lengthens sales cycles in regulated verticals. Some buyers adopt hybrid-cloud models to balance local control with global elasticity, complicating deployment architectures.
Other drivers and restraints analyzed in the detailed report include:
- Low-Latency 5G and Edge Acceleration
- Hybrid-Work Mandates Driving Room Upgrades
- Bandwidth Constraints in Emerging Economies
For complete list of drivers and restraints, kindly check the Table Of Contents.
Segment Analysis
Application-management suites accounted for the largest video as a service market share in 2024, accounting for 34% of global revenue. Enterprises rank meeting orchestration, calendar integration, and real-time security controls as baseline requirements. Low-code connectors allow human resources teams to schedule onboarding sessions without IT tickets, widening user bases and lifting per-tenant minute volumes. Vendors differentiate in meeting-lifecycle visualisations that trace attendee engagement down to reaction-emoji frequency.
Content-management platforms, however, are forecast to outpace other categories with a 16.5% CAGR to 2030. Buyers increasingly view metadata, chaptering, and compliance tagging as core. Providers expose these functions through software development kits that insert playback widgets in employee portals. The video as a service market size for content-centric modules is anticipated to expand as retention policies converge with ESG archiving mandates. Device-management submodules now surface energy metrics, letting sustainability teams track per-endpoint power draw, a value add that ties platform renewal conversations to corporate climate goals.
Enterprise computing endpoints still captured 55% of the video as a service market size in 2024. Desktop and laptop clients integrate single sign-on and policy enforcement, supporting regulated industries. Rich screen-share functions and keyboard accessibility features keep knowledge-worker engagement high. Vendors refine background-noise suppression tuned for open-plan offices, improving clarity without raising bitrate.
Mobile devices will add the most net new users at an 18% CAGR between 2025 and 2030. Flagship handsets now support cinematic mode with real-time depth mapping, encouraging marketing teams to produce internal updates entirely on mobile workflows. This shift compresses video production timelines from weeks to hours. The video as a service market share for mobile is expected to broaden once 5G coverage blankets suburban zones, removing reliability hesitation among field staff. At the room scale, demand coalesces around ceiling-mounted 360-degree cameras with intelligent audio zoning, equalising voice pickup for remote participants.
Video As A Service Market is Segmented by Platform (Application Management, Device Management, and More), Device (Mobility Devices, Enterprise Computing, Room-Based Endpoints), Service (Managed, Professional), Deployment Model (Public Cloud, Private Cloud, Hybrid Cloud), End-User Industry (Government and Defense, BFSI, and More), Geography. The Market Forecasts are Provided in Terms of Value (USD).
Geography Analysis
North America preserved leadership with 38% of global revenue in 2024, underpinned by high cloud maturity, robust capital-market appetite for recurring-revenue software, and early AI content-governance deployments. US enterprises integrate speech analytics with executive briefing libraries, while Canadian bilingual regulations spur automatic translation demand. Government-funded broadband grants sustain rural bandwidth, extending video reach into smaller municipalities. The region is also early to trial edge-compute offload, reducing central-cloud hops for IoT video analytics.
Asia-Pacific is projected to post a 17% CAGR to 2030, the fastest among all territories. Singapore added 150 MW of new colocation capacity in 2024, and Seoul doubled 5G standalone coverage, enabling regional SaaS expansion. Many ASEAN enterprises skipped legacy PBX stages altogether, so first-time video roll-outs are natively cloud-based. Linguistic diversity drives in-app caption localisation, creating competitive differentiation for providers with broad language packs. Edge nodes launched in Indonesia and the Philippines trim first-mile jitter, improving experience parity for archipelagic users.
Europe remains defined by stringent data-protection statutes and aggressive decarbonisation goals. A German automotive group replaced 8 000 inter-city flights with video in 2024, lowering Scope 3 emissions intensity by 4%. Emissions auditors accept VaaS dashboards as proxy evidence for avoided travel, anchoring video budgets inside ESG frameworks. Sovereign-cloud preferences fragment vendor support demands across multiple sub-regions. The bloc's Digital Markets Act pushes for open interoperability, nudging providers to adopt standards-based codecs and authentication plugins.
- Cisco Systems Inc.
- Zoom Video Communications Inc.
- Microsoft Corporation
- Google LLC
- Huawei Technologies Co. Ltd.
- Adobe Inc.
- Poly (HP Inc.)
- Avaya LLC
- Brightcove Inc.
- Symphony Communication Services
- Pexip AS
- LogMeIn Inc. (GoTo)
- Agora.io
- RingCentral Inc.
- 8x8 Inc.
- Amazon Web Services (Amazon Chime)
- Orange Business Services
- Vonage
- Tata Communications Ltd.
- Kaltura Inc.
- Genesys Telecommunications Labs
Additional Benefits:
- The market estimate (ME) sheet in Excel format
- 3 months of analyst support
TABLE OF CONTENTS
1 INTRODUCTION
- 1.1 Study Assumptions and Market Definition
- 1.2 Scope of the Study
2 RESEARCH METHODOLOGY
3 EXECUTIVE SUMMARY
4 MARKET LANDSCAPE
- 4.1 Market Overview
- 4.2 Market Drivers
- 4.2.1 Growing Corporate Shift from CAPEX-Heavy Video Infrastructure to OPEX-Friendly Cloud Subscriptions
- 4.2.2 Surging Consumption of Embedded Video APIs in Customer-Facing Apps (Banking, Retail, Tele-health)
- 4.2.3 Proliferation of Low-Latency 5G Networks in North America and Asia Accelerating UHD VaaS Adoption
- 4.2.4 Hybrid-Work Mandates Triggering Multi-Camera Room Upgrades Across Global 1000 Firms
- 4.2.5 AI-Powered Video Content Management Enhancing Compliance and Searchability for Regulated Industries
- 4.2.6 Rising Carbon-Reduction Targets Driving Preference for Cloud Video over Travel in Europe
- 4.3 Market Restraints
- 4.3.1 Persistent Concerns over Sovereign Data Residency in Government and BFSI Verticals
- 4.3.2 High Bandwidth Costs in Emerging African and Caribbean Markets Limiting HD Video Quality
- 4.3.3 Complex Legacy System Integration in Large Telecom and Manufacturing Enterprises
- 4.3.4 Intellectual-Property and Content-Licensing Risks in Cross-Border Video Distribution
- 4.4 Regulatory Outlook
- 4.5 Technological Outlook
- 4.6 Porter's Five Forces Analysis
- 4.6.1 Bargaining Power of Buyers
- 4.6.2 Bargaining Power of Suppliers
- 4.6.3 Threat of New Entrants
- 4.6.4 Threat of Substitutes
- 4.6.5 Intensity of Competitive Rivalry
- 4.7 Assessment of Impact of Macro-Economic Trends
5 MARKET SIZE AND GROWTH FORECASTS (VALUE)
- 5.1 By Platform
- 5.1.1 Application Management
- 5.1.2 Device Management
- 5.1.3 Network Management
- 5.1.4 Video Content Management
- 5.2 By Device
- 5.2.1 Mobility Devices
- 5.2.2 Enterprise Computing
- 5.2.3 Room-based Endpoints
- 5.3 By Service
- 5.3.1 Managed
- 5.3.2 Professional
- 5.4 By Deployment Model
- 5.4.1 Public Cloud
- 5.4.2 Private Cloud
- 5.4.3 Hybrid Cloud
- 5.5 By End-user Industry
- 5.5.1 Government and Defense
- 5.5.2 BFSI
- 5.5.3 Healthcare and Life Sciences
- 5.5.4 IT and Telecom
- 5.5.5 Media and Entertainment
- 5.5.6 Manufacturing
- 5.5.7 Education
- 5.5.8 Retail and E-Commerce
- 5.5.9 Other End-user Industries
- 5.6 By Geography
- 5.6.1 North America
- 5.6.1.1 United States
- 5.6.1.2 Canada
- 5.6.1.3 Mexico
- 5.6.2 South America
- 5.6.2.1 Brazil
- 5.6.2.2 Argentina
- 5.6.2.3 Rest of South America
- 5.6.3 Europe
- 5.6.3.1 Germany
- 5.6.3.2 United Kingdom
- 5.6.3.3 France
- 5.6.3.4 Italy
- 5.6.3.5 Spain
- 5.6.3.6 Rest of Europe
- 5.6.4 Asia-Pacific
- 5.6.4.1 China
- 5.6.4.2 Japan
- 5.6.4.3 South Korea
- 5.6.4.4 India
- 5.6.4.5 Australia
- 5.6.4.6 New Zealand
- 5.6.4.7 Rest of Asia-Pacific
- 5.6.5 Middle East and Africa
- 5.6.5.1 United Arab Emirates
- 5.6.5.2 Saudi Arabia
- 5.6.5.3 South Africa
- 5.6.5.4 Rest of Middle East and Africa
- 5.6.1 North America
6 COMPETITIVE LANDSCAPE
- 6.1 Strategic Developments
- 6.2 Vendor Positioning Analysis
- 6.3 Company Profiles (includes Global level Overview, Market level overview, Core Segments, Financials as available, Strategic Information, Products and Services, and Recent Developments)
- 6.3.1 Cisco Systems Inc.
- 6.3.2 Zoom Video Communications Inc.
- 6.3.3 Microsoft Corporation
- 6.3.4 Google LLC
- 6.3.5 Huawei Technologies Co. Ltd.
- 6.3.6 Adobe Inc.
- 6.3.7 Poly (HP Inc.)
- 6.3.8 Avaya LLC
- 6.3.9 Brightcove Inc.
- 6.3.10 Symphony Communication Services
- 6.3.11 Pexip AS
- 6.3.12 LogMeIn Inc. (GoTo)
- 6.3.13 Agora.io
- 6.3.14 RingCentral Inc.
- 6.3.15 8x8 Inc.
- 6.3.16 Amazon Web Services (Amazon Chime)
- 6.3.17 Orange Business Services
- 6.3.18 Vonage
- 6.3.19 Tata Communications Ltd.
- 6.3.20 Kaltura Inc.
- 6.3.21 Genesys Telecommunications Labs
7 MARKET OPPORTUNITIES AND FUTURE OUTLOOK
- 7.1 White-space and Unmet-Need Assessment

