
PUBLISHER: Mordor Intelligence | PRODUCT CODE: 1850095

PUBLISHER: Mordor Intelligence | PRODUCT CODE: 1850095
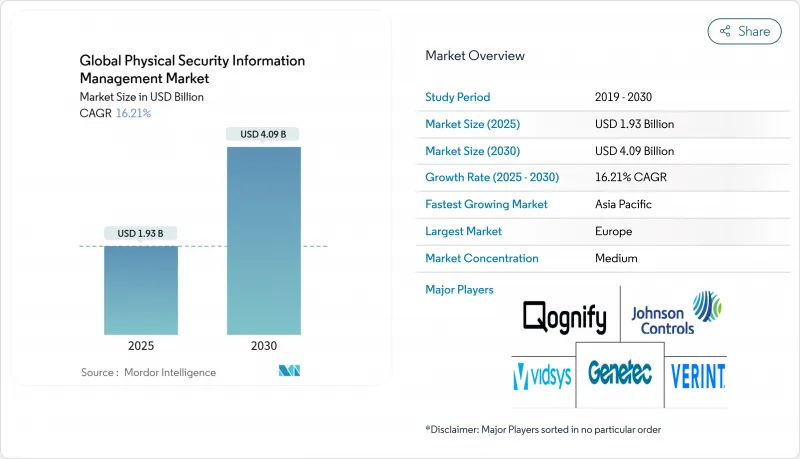
Global Physical Security Information Management - Market Share Analysis, Industry Trends & Statistics, Growth Forecasts (2025 - 2030)
The physical security information management market size stands at USD 1.93 billion in 2025 and is projected to advance to USD 4.09 billion by 2030, reflecting a 16.21% CAGR over the forecast horizon.
Rapid sensor proliferation, tighter regulations, and a pivot toward converged physical-cyber protection are reshaping capital allocation decisions, pushing chief security officers to prioritize unified command platforms. Demand is intensifying in transportation hubs, data-center campuses, and healthcare networks where diverse sensor estates, hybrid-work patterns, and liability exposures intersect. Vendors are responding with open orchestration layers, cloud-ready deployments, and subscription-based managed services that lower entry barriers while shortening deployment cycles. Competitive intensity is rising as established building-automation leaders, specialist PSIM providers, and public-cloud hyperscalers race to embed AI analytics, geospatial visualization, and workflow automation into a single operational picture.
Global Physical Security Information Management Market Trends and Insights
Proliferation of IoT-enabled Edge Sensors
A surge to 41.6 billion connected devices by 2025 is driving record volumes of telemetry that siloed tools cannot correlate. Critical facilities now juggle more than 500 heterogeneous sensors, a 43% jump since 2022, compelling operators to adopt vendor-agnostic orchestration engines that normalize metadata and prioritize alerts.Open APIs have become a must-have procurement criterion as security managers seek future-proof integration paths for smart cameras, environmental probes, and biometric endpoints. Heightened data granularity is also improving root-cause analysis, allowing response teams to trace event chains and shorten mean time to resolution. The resulting operational gains are reinforcing the business case for next-generation platforms across energy, utilities, and smart-city programs.
EU NIS2 & U.S. CISA Critical-Infrastructure Mandates
Regulatory pressure now carries meaningful financial teeth: the revised NIS2 framework sets penalties up to EUR 10 million (USD 11.3 million) for non-compliance, while CISA's CIRCIA rule enforces 24- to 72-hour reporting windows. Operators in power, transport, and healthcare sectors are therefore accelerating platform upgrades that automate incident documentation, evidence retention, and audit trails. Procurement teams favor solutions delivering out-of-the-box policy templates, role-based access, and encryption controls that align with European GDPR requirements. Early adopters in finance and pharmaceuticals report smoother board approvals once compliance automation is quantified against potential fines. Vendors with native policy-mapping engines and pre-built regulator dashboards are consequently widening their addressable base.
Integration Complexity with Legacy Analog & Proprietary Systems
Industrial plants and transport hubs often rely on proprietary protocols first deployed 15-20 years ago, elevating data normalization challenges that extend implementation timelines by up to 60%. Adapter layers frequently struggle to translate low-bandwidth serial feeds into modern data schemas, forcing integrators to script custom converters that raise the total cost of ownership. Energy utilities face the sharpest hurdles where SCADA interfaces resist open API exposure. The resulting project overruns dent stakeholder confidence and slow rollouts in sectors where downtime tolerance is close to zero. Vendors offering pre-certified driver libraries and migration toolkits are therefore gaining a comparative advantage.
Other drivers and restraints analyzed in the detailed report include:
- Rapid Uptake of AI Video-Analytics
- Asian Mega-Transit Projects
- High Up-front Licensing & Customisation Costs
For complete list of drivers and restraints, kindly check the Table Of Contents.
Segment Analysis
Solutions retained a 68% slice of the physical security information management market share in 2024, anchored by perpetual licences and subscription renewals for command-and-control software. The physical security information management market size generated by solutions is buoyed by critical infrastructure refresh cycles and feature expansions such as AI plug-ins and geospatial dashboards.
However, managed services are set to chart a 16.9% CAGR, a pace outstripping the core software line. Demand is strongest among organizations lacking in-house operators for 24/7 monitoring, incident triage, and threat-hunting routines. Service providers leverage multitenant architectures to amortize analyst teams across contracts, offering clients predictable monthly outlays and service-level guarantees. Professional services-consulting, design, and integration-continue to underpin complex rollouts, particularly where legacy PLCs, fire-alarm panels, and building-management systems must be bridged. Vendor success increasingly hinges on bundling advisory and run operations into cohesive outcome-based packages that ease buyer concerns over skill shortages and long-term platform upkeep.
On-premise systems controlled 74% of the physical security information management market size in 2024 as operators in utilities, defense, and financial services favored data-sovereign, air-gapped installations. These environments often integrate directly with emergency intercoms, access gates, and industrial controls that demand millisecond latencies and deterministic network behavior.
Yet, cloud deployments will expand at an 18.1% CAGR, fueled by demand for elastic compute to run AI inference, centralized reporting across distributed estates, and simplified patch management. Early adopters leverage cloud video surveillance to offload storage costs, routing only event flags to local edge devices for rapid interdiction. Hybrid architectures are gaining traction where sensitive streams stay on-site while analytics dashboards and machine-learning pipelines reside in regional data centers.
The Physical Security Information Management Market is Segmented by Component (Solutions and Services), Deployment (On-Premise, Cloud, and Hybrid), Integration Method (API-Based Orchestration, Middleware/Adapter Layer), End-User Industry (BFSI, Government and Defense, Transportation and Logistics, and More), and by Geography. The Market Forecasts are Provided in Terms of Value (USD).
Geography Analysis
North America commanded 35% of global revenue for the physical security information management market in 2024, underpinned by federal critical-infrastructure mandates and mature systems-integration ecosystems. Insurance carriers offering 15-30% premium incentives for verifiable monitoring platforms further encourage adoption, especially among colocation data-center operators and regional utilities. Convergence of physical and cyber telemetry remains a strategic agenda, with 68% of chief security officers noting incident overlaps since 2023.
Asia is projected to expand at an 17.9% CAGR through 2030, propelled by USD 1.7 trillion in transit megaprojects and escalating smart-city deployments. Local authorities prioritize centralized situational awareness to coordinate multi-agency responses across metro lines, bus terminals, and airports. Vendor strategies increasingly incorporate joint ventures with domestic integrators to offset skill shortages and comply with procurement localization rules. Asia will eclipse North America in physical security information management market size within the next decade.
Europe's growth trajectory is tightly linked to the enforcement timetable for the NIS2 Directive, which broadens compliance scope to thousands of essential and important entities. Security leaders are deploying platforms that automate incident reporting, evidence archiving, and role-based escalation to satisfy regulators. Preference for open standards is pronounced, reflecting diverse installed bases across member states. Sustainability is emerging as a procurement criterion, with PSIM rollouts expected to integrate energy-management insights and contribute to corporate ESG disclosures.
- Genetec Inc.
- Johnson Controls International plc (incl. Tyco Software House)
- Verint Systems Inc.
- Qognify (a Hexagon company)
- Everbridge Inc.
- Hexagon AB
- AxxonSoft Inc.
- LenelS2
- Advancis Software and Services GmbH
- Milestone Systems A/S
- Bosch Building Technologies
- Honeywell International Inc.
- Axis Communications AB
- Indigovision Group
- Pelco (Motorola Solutions)
- Prysm Software
- Ela-Soft GmbH
- VIDEONEXT Network Solutions
- Octopus Systems
- FAST Systems Inc.
- Easypsim AG
Additional Benefits:
- The market estimate (ME) sheet in Excel format
- 3 months of analyst support
TABLE OF CONTENTS
1 INTRODUCTION
- 1.1 Study Assumptions and Market Definition
- 1.2 Scope of the Study
2 RESEARCH METHODOLOGY
3 EXECUTIVE SUMMARY
4 MARKET LANDSCAPE
- 4.1 Market Overview
- 4.2 Market Drivers
- 4.2.1 Proliferation of IoT-enabled Edge Sensors Driving Unified Command Platforms
- 4.2.2 EU NIS2 and U.S. CISA Critical-Infrastructure Mandates Accelerating Adoption
- 4.2.3 Asian Mega-Transit Projects Requiring Centralised Situational Awareness
- 4.2.4 Rapid Uptake of AI Video-Analytics Creating Demand for Open PSIM Orchestration
- 4.2.5 Hybrid-Work Security Gaps Fueling Physical-Cyber Converged Solutions
- 4.2.6 Insurance Premium Discounts Linked to PSIM Compliance for Data Centres
- 4.3 Market Restraints
- 4.3.1 Integration Complexity with Legacy Analog and Proprietary Systems
- 4.3.2 High Up-front Licensing and Customisation Costs for Tier-1 Platforms
- 4.3.3 Shortage of PSIM-Skilled System Integrators in Emerging Markets
- 4.3.4 Data-Sovereignty Rules Limiting Cloud-Based Deployments
- 4.4 Value / Supply-Chain Analysis
- 4.5 Regulatory Outlook
- 4.6 Technological Outlook
- 4.7 Porter's Five Forces
- 4.7.1 Bargaining Power of Suppliers
- 4.7.2 Bargaining Power of Buyers
- 4.7.3 Threat of New Entrants
- 4.7.4 Threat of Substitutes
- 4.7.5 Intensity of Competitive Rivalry
5 MARKET SIZE AND GROWTH FORECASTS (VALUE)
- 5.1 By Component
- 5.1.1 Solutions
- 5.1.1.1 Video / Incident Management
- 5.1.1.2 Access-Control Integration
- 5.1.1.3 Command-and-Control Dashboards
- 5.1.1.4 Case and Evidence Management
- 5.1.2 Services
- 5.1.2.1 Professional (Consulting, Design and Integration)
- 5.1.2.2 Managed and Support
- 5.1.1 Solutions
- 5.2 By Deployment Model
- 5.2.1 On-premise
- 5.2.2 Cloud
- 5.2.3 Hybrid
- 5.3 By Integration Method
- 5.3.1 API-Based Orchestration
- 5.3.2 Middleware / Adapter Layer
- 5.4 By End-user Industry
- 5.4.1 BFSI
- 5.4.2 Government and Defense
- 5.4.3 Transportation and Logistics
- 5.4.3.1 Airports
- 5.4.3.2 Maritime Ports
- 5.4.3.3 Rail and Metro
- 5.4.4 Energy and Utilities
- 5.4.5 Retail
- 5.4.6 Healthcare
- 5.4.7 Manufacturing and Industrial
- 5.4.8 Education
- 5.4.9 IT and Telecom
- 5.5 By Geography
- 5.5.1 North America
- 5.5.1.1 United States
- 5.5.1.2 Canada
- 5.5.1.3 Mexico
- 5.5.2 South America
- 5.5.2.1 Brazil
- 5.5.2.2 Argentina
- 5.5.2.3 Rest of South America
- 5.5.3 APAC
- 5.5.3.1 China
- 5.5.3.2 India
- 5.5.3.3 Japan
- 5.5.3.4 South Korea
- 5.5.3.5 Australia
- 5.5.3.6 New Zealand
- 5.5.3.7 Rest of APAC
- 5.5.4 Europe
- 5.5.4.1 Germany
- 5.5.4.2 United Kingdom
- 5.5.4.3 France
- 5.5.4.4 Italy
- 5.5.4.5 Nordics
- 5.5.4.6 Rest of Europe
- 5.5.5 Middle East and Africa
- 5.5.5.1 Saudi Arabia
- 5.5.5.2 UAE
- 5.5.5.3 Turkey
- 5.5.5.4 South Africa
- 5.5.5.5 Rest of Middle East and Africa
- 5.5.1 North America
6 COMPETITIVE LANDSCAPE
- 6.1 Market Concentration
- 6.2 Strategic Moves
- 6.3 Market Share Analysis
- 6.4 Company Profiles (includes Global level Overview, Market level overview, Core Segments, Financials as available, Strategic Information, Market Rank/Share for key companies, Products and Services, and Recent Developments)
- 6.4.1 Genetec Inc.
- 6.4.2 Johnson Controls International plc (incl. Tyco Software House)
- 6.4.3 Verint Systems Inc.
- 6.4.4 Qognify (a Hexagon company)
- 6.4.5 Everbridge Inc.
- 6.4.6 Hexagon AB
- 6.4.7 AxxonSoft Inc.
- 6.4.8 LenelS2
- 6.4.9 Advancis Software and Services GmbH
- 6.4.10 Milestone Systems A/S
- 6.4.11 Bosch Building Technologies
- 6.4.12 Honeywell International Inc.
- 6.4.13 Axis Communications AB
- 6.4.14 Indigovision Group
- 6.4.15 Pelco (Motorola Solutions)
- 6.4.16 Prysm Software
- 6.4.17 Ela-Soft GmbH
- 6.4.18 VIDEONEXT Network Solutions
- 6.4.19 Octopus Systems
- 6.4.20 FAST Systems Inc.
- 6.4.21 Easypsim AG
7 MARKET OPPORTUNITIES AND FUTURE OUTLOOK
- 7.1 White-space and Unmet-Need Assessment

