
PUBLISHER: Mordor Intelligence | PRODUCT CODE: 1850220

PUBLISHER: Mordor Intelligence | PRODUCT CODE: 1850220
Wearable Sensors - Market Share Analysis, Industry Trends & Statistics, Growth Forecasts (2025 - 2030)
The wearable sensors market stood at USD 4.88 billion in 2025 and is forecast to reach USD 10.54 billion by 2030, advancing at a 16.65% CAGR.
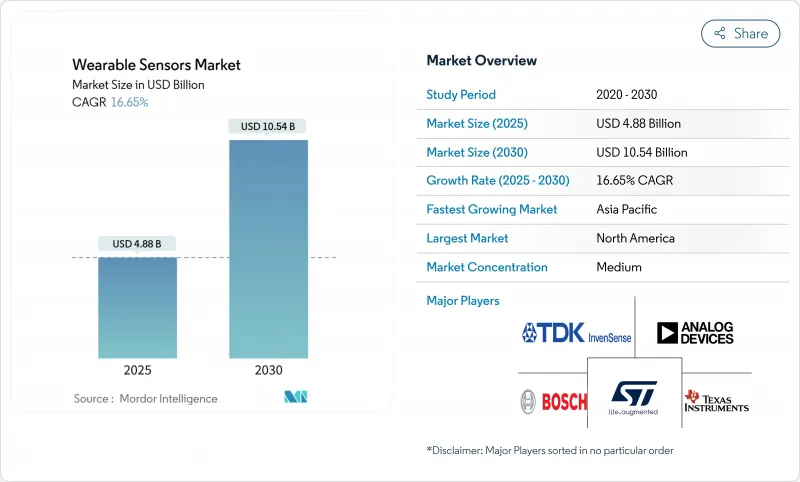
Robust demand for continuous physiological tracking, declining MEMS production costs, and regulatory support for remote patient monitoring underpin this expansion. Semiconductor suppliers are embedding on-device machine-learning cores that cut system power budgets and unlock always-on analytics, while 5G rollouts reduce data-transfer latency and enhance clinical workflow efficiency. Corporate wellness programs, exemplified by Chevron's hydration-patch deployment, add enterprise-scale volumes and diversify end-market exposure chevron.com. Together, these factors keep the wearable sensors market on a high-growth trajectory even as battery-material shortages and privacy statutes raise execution risk.
Global Wearable Sensors Market Trends and Insights
Fitness & Preventive-Health Boom
Consumers are shifting from episodic treatment toward continuous wellness management, driving recurring demand for smartwatches and patches that track metabolic, sleep, and stress signals. Corporations reinforce uptake through large-scale wellness deployments that deliver measurable ROI in productivity and safety, such as Chevron's hydration patches that lowered heat-related incidents. AI-powered coaching modules from Samsung and others convert raw metrics into personalized guidance, which sustains day-to-day engagement and expands data pools for algorithm training . Health-plan providers also gain: a hypertension RPM program posted a 22.2% ROI through reduced emergency visits, validating reimbursement pathways that further enlarge the wearable sensors market .
Smart-Watch Unit Surge
Global smartwatch shipments continue to climb as Apple, Samsung, and emerging ring vendors integrate blood-pressure and neuro-signal sensors to differentiate in a saturating form-factor race. STMicroelectronics' MEMS volume increased to USD 1.198 billion in Q4 2024, underscoring manufacturing resilience and price elasticity that keep average selling prices in check. IP battles, such as Samsung's pre-emptive lawsuit against Oura, signal a maturing arena where patents become a key strategic lever rather than speed-to-market alone
Data-Privacy Regulation Tightenings
Washington's My Health My Data Act and the EU MDR add overlapping consent and documentation obligations that lift compliance spend and slow multi-region rollouts. Only 43 notified bodies cover roughly 500,000 devices in Europe, creating certification bottlenecks that reward incumbents with legacy approvals
Other drivers and restraints analyzed in the detailed report include:
- MEMS Cost Downsizing
- Remote-Patient-Monitoring Mandates
- High ASP for Multimodal Sensors
For complete list of drivers and restraints, kindly check the Table Of Contents.
Segment Analysis
Motion sensors captured 34% of wearable sensors market share in 2024, anchoring user motion analytics across fitness bands and gesture-controlled interfaces. Accelerometers, gyroscopes, and magnetometers hold mature cost curves, preserving gross margins despite ASP pressure. Biosensors, however, post a 19.4% CAGR and will challenge this hierarchy as skin-conformal chemistry extends use cases from glucose to cortisol monitoring.
Biosensor momentum derives from polymer microfluidics that deliver laboratory-grade specificity without venipuncture. Chemical and gas sensors fill industrial safety niches, while pressure devices support cuff-less blood-pressure applications. Temperature sensors win occupational-health mandates for heat-stress prevention. Image and optical sensors migrate from heart-rate photoplethysmography toward optical coherence-based wound care, foreshadowing multimodal fusion that enlarges the wearable sensors market.
Health and wellness held 46% revenue, reflecting entrenched consumer behavior and smartphone app synergies that keep churn low. The wearable sensors market size for health and wellness reached USD 2.25 billion in 2025 and still expands as value-added coaching services bundle subscriptions with hardware.
Remote patient monitoring, advancing at 20.1% CAGR, gains ground as payers seek cost-avoidance through early detection. Multi-sensor gateways feeding cloud AI shorten clinician response times, and reimbursement parity with in-clinic visits strengthens provider economics. Sports analytics continue to grow into biomechanics, while industrial safety wearables earn procurement budgets through measurable injury reduction, such as 30% fewer musculoskeletal claims in pilot factories
The Wearable Sensors Market is Segmented by Sensor Type (Chemical and Gas, Pressure and More), Application (Health and More), Device Form Factor (Smartwatches and More), End-User Industry (Consumer, Healthcare Providers and More), Connectivity Technology (NFC and More) and Geography. The Market Forecasts are Provided in Terms of Value (USD).
Geography Analysis
North America commands 38% of 2024 revenue, underpinned by Medicare RPM codes that reimburse continuous monitoring and corporate wellness budgets that subsidize device rollouts. Venture-capital density anchors a startup pipeline that feeds specialized sensor modalities such as neural interfaces. Nonetheless, state-level data laws amplify compliance overhead and could dilute cross-border data-science synergies.
Asia-Pacific leads growth with an 18.7% CAGR as China's component factories compress lead times and India's middle-income cohort adopts low-cost wristbands. Japan's silver-economy drives hospital investments in continuous vitals patches, while South Korea's 5G coverage accelerates cloud-to-edge analytic loops. Regional dominance in battery supply also moderates cost inflation risks, though geopolitical frictions could disrupt export flows.
Europe sustains mid-single-digit growth. MDR capacity constraints impede CE-mark renewal cycles, effectively lengthening device replacement lifetimes and slowing innovation churn. Yet public-sector appetite for e-health remains strong, especially in Germany's Digital Healthcare Act framework that subsidizes app-linked devices. Southern and Eastern Europe see incremental demand as telemedicine fills provider-access gaps.
- STMicroelectronics
- Texas Instruments
- Infineon Technologies
- Analog Devices
- TDK / InvenSense
- AMS-OSRAM
- Panasonic
- NXP Semiconductors
- TE Connectivity
- Bosch Sensortec
- Apple
- Fitbit (Google)
- Samsung Electronics
- Huawei
- Sensirion
- Knowles Corporation
- Valencell
- Murata Manufacturing
- Honeywell International
- Qualcomm
Additional Benefits:
- The market estimate (ME) sheet in Excel format
- 3 months of analyst support
TABLE OF CONTENTS
1 INTRODUCTION
- 1.1 Study Assumptions and Market Definition
- 1.2 Scope of the Study
2 RESEARCH METHODOLOGY
3 EXECUTIVE SUMMARY
4 MARKET LANDSCAPE
- 4.1 Market Overview
- 4.2 Market Drivers
- 4.2.1 Fitness and preventive-health boom
- 4.2.2 Smart-watch unit surge
- 4.2.3 MEMS cost downsizing
- 4.2.4 Remote-patient-monitoring mandates
- 4.2.5 Skin-conformal bio-sensor breakthroughs
- 4.2.6 Corporate ESG-linked wearables programs
- 4.3 Market Restraints
- 4.3.1 Data-privacy regulation tightenings
- 4.3.2 High ASP for multimodal sensors
- 4.3.3 Chronic Li-ion cell shortages
- 4.3.4 Algorithmic racial-bias litigation risk
- 4.4 Value / Supply-Chain Analysis
- 4.5 Regulatory Landscape
- 4.6 Technological Outlook
- 4.7 Porters Five Forces Analysis
- 4.7.1 Threat of New Entrants
- 4.7.2 Bargaining Power of Suppliers
- 4.7.3 Bargaining Power of Buyers
- 4.7.4 Threat of Substitutes
- 4.7.5 Intensity of Rivalry
5 MARKET SIZE AND GROWTH FORECASTS (VALUE)
- 5.1 By Sensor Type
- 5.1.1 Chemical and Gas
- 5.1.2 Pressure
- 5.1.3 Image / Optical
- 5.1.4 Motion
- 5.1.5 Temperature
- 5.1.6 Biosensors
- 5.2 By Application
- 5.2.1 Health and Wellness
- 5.2.2 Safety Monitoring
- 5.2.3 Sports and Fitness
- 5.2.4 Military and Industrial
- 5.3 By Device Form Factor
- 5.3.1 Smartwatches
- 5.3.2 Patches
- 5.3.3 Smart Clothing
- 5.3.4 Smart Glasses
- 5.3.5 Hearables
- 5.3.6 Footwear
- 5.4 By End-User Industry
- 5.4.1 Consumer
- 5.4.2 Healthcare Providers
- 5.4.3 Industrial/Enterprise
- 5.4.4 Defense and First Responders
- 5.5 By Connectivity Technology
- 5.5.1 Bluetooth
- 5.5.2 Wi-Fi
- 5.5.3 NFC
- 5.5.4 Cellular (LTE/5G)
- 5.5.5 ANT+ / Proprietary
- 5.6 By Geography
- 5.6.1 North America
- 5.6.1.1 United States
- 5.6.1.2 Canada
- 5.6.1.3 Mexico
- 5.6.2 South America
- 5.6.2.1 Brazil
- 5.6.2.2 Argentina
- 5.6.2.3 Rest of South America
- 5.6.3 Europe
- 5.6.3.1 Germany
- 5.6.3.2 United Kingdom
- 5.6.3.3 France
- 5.6.3.4 Italy
- 5.6.3.5 Spain
- 5.6.3.6 Russia
- 5.6.3.7 Rest of Europe
- 5.6.4 APAC
- 5.6.4.1 China
- 5.6.4.2 Japan
- 5.6.4.3 India
- 5.6.4.4 South Korea
- 5.6.4.5 Australia
- 5.6.4.6 Rest of APAC
- 5.6.5 Middle East and Africa
- 5.6.5.1 Middle East
- 5.6.5.1.1 Saudi Arabia
- 5.6.5.1.2 UAE
- 5.6.5.1.3 Turkey
- 5.6.5.1.4 Rest of Middle East
- 5.6.5.2 Africa
- 5.6.5.2.1 South Africa
- 5.6.5.2.2 Nigeria
- 5.6.5.2.3 Rest of Africa
- 5.6.1 North America
6 COMPETITIVE LANDSCAPE
- 6.1 Market Concentration
- 6.2 Strategic Moves
- 6.3 Market Share Analysis
- 6.4 Company Profiles (includes Global level Overview, Market level overview, Core Segments, Financials as available, Strategic Information, Market Rank/Share, Products & Services, Recent Developments)
- 6.4.1 STMicroelectronics
- 6.4.2 Texas Instruments
- 6.4.3 Infineon Technologies
- 6.4.4 Analog Devices
- 6.4.5 TDK / InvenSense
- 6.4.6 AMS-OSRAM
- 6.4.7 Panasonic
- 6.4.8 NXP Semiconductors
- 6.4.9 TE Connectivity
- 6.4.10 Bosch Sensortec
- 6.4.11 Apple
- 6.4.12 Fitbit (Google)
- 6.4.13 Samsung Electronics
- 6.4.14 Huawei
- 6.4.15 Sensirion
- 6.4.16 Knowles Corporation
- 6.4.17 Valencell
- 6.4.18 Murata Manufacturing
- 6.4.19 Honeywell International
- 6.4.20 Qualcomm
7 MARKET OPPORTUNITIES AND FUTURE OUTLOOK
- 7.1 White-Space and Unmet-Need Assessment

