
PUBLISHER: Mordor Intelligence | PRODUCT CODE: 1850293

PUBLISHER: Mordor Intelligence | PRODUCT CODE: 1850293
Precious Metal Catalysts - Market Share Analysis, Industry Trends & Statistics, Growth Forecasts (2025 - 2030)
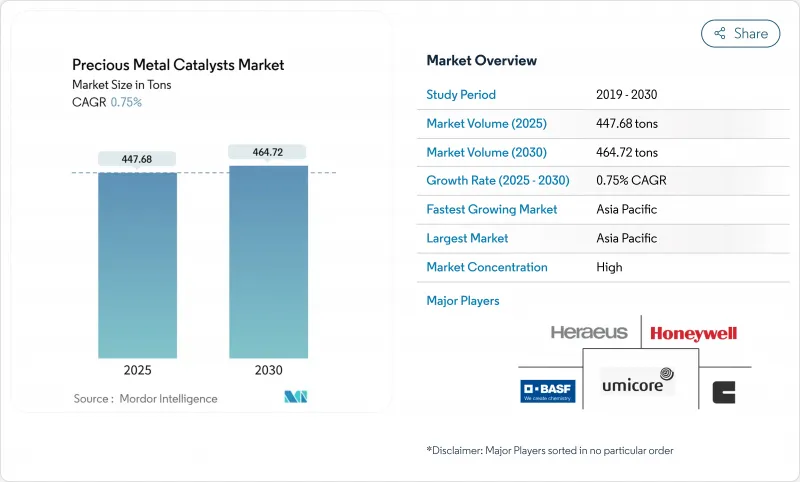
The precious metal catalysts market size stands at 447.68 tons in 2025 and is forecast to reach 464.72 tons by 2030, translating to a steady 0.75% CAGR.
The modest expansion underscores a shift from volume-led growth toward efficiency-driven demand as producers prioritize lower metal loadings and tighter deposition control. Stricter global emission norms, widening hydrogen economy investments, and refinery upgrades sustain catalyst consumption even as pure battery-electric vehicles reduce internal-combustion volumes. Consolidation among leading suppliers and aggressive recycling investments temper raw-material risk, while substitution strategies reshape the competitive landscape, chiefly palladium-to-platinum. Across applications, automotive emission controls remain dominant, but green-hydrogen electrolysis, fuel cells, and electronic materials provide the fastest-rising demand avenues, signalling structural diversification of the precious metal catalysts market.
Global Precious Metal Catalysts Market Trends and Insights
Stricter Tailpipe and Stationary Emission Regulations
Euro 7 standards take effect from 2027, mandating 50% lower NOx for light-duty vehicles, while China National VI(b) extends heavy-duty compliance through 2025, sustaining rhodium-platinum demand in autocatalysts. EPA Tier 4 diesel engine rules simultaneously drive stationary demand, and industrial gas-turbine operators now specify precious-metal SCR systems capable of sub-10 ppm NOx. Divergent regional standards force catalyst suppliers to maintain multi-jurisdictional formulations, reinforcing resilient volume growth despite shrinking per-vehicle loadings in a more electrified fleet.
Green-hydrogen Build-out Driving Iridium/Platinum Catalyst Demand
PEM electrolysis stacks consume 0.3-0.7 g of iridium per kW capacity, and global green-hydrogen projects led by Germany, Japan, and South Korea lift iridium and platinum intensity. Tanaka Precious Metals has introduced dual-function PEM catalysts that slash iridium usage by 20% while improving gas crossover suppression.
Persistent PGM Price Volatility and Supply-chain Shocks
South African load-shedding and Russian export uncertainty cause platinum and palladium price swings that complicate procurement for catalyst makers locked into fixed-price contracts. Automakers now hedge inventory and accelerate lower-loading designs, yet qualification cycles stretch two years, cushioning near-term flexibility.
Other drivers and restraints analyzed in the detailed report include:
- Rising Demand for Higher-octane Clean Fuels from New Petro-refining Capacity
- Substitution of Palladium with Platinum in Tri-metal Autocatalysts
- Growing EV Penetration Reducing ICE Autocatalyst Volumes
For complete list of drivers and restraints, kindly check the Table Of Contents.
Segment Analysis
Platinum continued to dominate the precious metal catalysts market with 40.86% share in 2024. The metal's cross-sector versatility secures lasting demand even as substitution trends evolve. In contrast, iridium is forecast to log a 2.98% CAGR through 2030, the fastest among all metals, reflecting its indispensable PEM role. The precious metal catalysts market size for iridium-based systems is projected to rise from 19 tons in 2025 to 23 tons by 2030 at the stated CAGR. Palladium, rhodium, and ruthenium retain niche growth, heavily tied to automotive and selective hydrogenation. The adoption of palladium nanosheets with platinum-equivalent HER performance, pioneered by Tokyo University of Science, may reshape cost hierarchies over the long term.
Powder catalysts retained a 52.91% share in 2024, sustained by widespread use in fine chemicals, pharma, and refinery hydrotreating. They are easy to blend, regenerate, and recycle, which keeps adoption high. Wash-coated monoliths, however, are on track for the quickest 1.60% CAGR to 2030, owing to next-generation gasoline particulate filters and diesel SCR blocks that demand high-duty thermal cycling.
Extrudates and pellets hold material shares in fixed-bed reactors, benefitting from low pressure drops and mechanical resilience. Honeycomb structures with engineered channel densities provide enhanced mass transfer in stationary NOx abatement systems, especially for gas-turbine exhaust. Cutting-edge additive techniques such as BASF's X3D now allow topology-optimized monoliths that push surface-to-volume ratios above 1,500 m2/m3, translating into lower PGM per unit throughput.
The Precious Metal Catalysts Market Report Segments the Industry by Metal Type (Platinum, Palladium, Rhodium, and More), Catalyst Form (Powder, Pellet/Bead, and More), Manufacturing Process (Incipient Wetness Impregnation, Electroless and Electrochemical Deposition, and More), Application (Automotive, Pharmaceutical, Petrochemicals, and Other Applications), and Geography (Asia-Pacific, North America, Europe, and More).
Geography Analysis
Asia-Pacific controlled 39.77% of the precious metal catalysts market in 2024, fueled by rapid industrialization, stricter national emission standards, and the world's most ambitious green-hydrogen rollouts. China alone plans 100 GW of electrolyzer capacity by 2030, prompting robust iridium and platinum uptake. India's Bharat Stage VII norms advance catalytic converter complexity, while Japan's leadership in fuel-cell vehicles lifts domestic demand for high-purity platinum-coated membranes.
North America remains an influential producer and consumer. Tight Tier 3 gasoline sulfur limits and EPA non-road diesel rules uphold domestic catalyst usage, even as EV sales top 15% of new registrations in 2025. Canada's PGM mining sector provides upstream security, although most refining happens in the United States. Mexico's growing vehicle assembly plants utilize advanced tri-metal converters to meet USMCA alignment.
Europe exhibits dual dynamics: the strictest emission caps globally sustain catalyst complexity, but the EU Fit-for-55 mandate accelerates BEV uptake, eroding long-term autocatalyst volumes. South America and the Middle-East, and Africa supply important raw materials and niche demand. Saudi Arabia and the UAE plan blue and green hydrogen megaprojects, positioning the Gulf as an emerging precious metal catalysts market over the next decade.
- ALS
- American Elements
- BASF
- Catalytic Products International
- CHIMET
- Clariant
- Evonik Industries AG
- Heraeus Precious Metals
- Honeywell International, Inc.
- Kaili Catalyst New Materials Co., Ltd.
- ReMetall Deutschland AG
- Sabin Metal Corp.
- Shaanxi kaida chemical co. LTD
- Stanford Advanced Materials
- Takasago International Corporation
- TANAKA PRECIOUS METAL GROUP Co., Ltd.
- Thermo Fisher Scientific Inc.
- Umicore
- Valterra Platinum Limited
Additional Benefits:
- The market estimate (ME) sheet in Excel format
- 3 months of analyst support
TABLE OF CONTENTS
1 Introduction
- 1.1 Study Assumptions and Market Definition
- 1.2 Scope of the Study
2 Research Methodology
3 Executive Summary
4 Market Landscape
- 4.1 Market Overview
- 4.2 Market Drivers
- 4.2.1 Stricter Tail-pipe and Stationary Emission Regulations
- 4.2.2 Rising Demand for Higher-octane Clean Fuels from New Petro-refining Capacity
- 4.2.3 Substitution of Palladium with Platinum in Tri-metal Autocatalysts
- 4.2.4 Green-hydrogen Build-out Driving Iridium/Platinum Catalyst Demand
- 4.2.5 Commercialisation of Precious-metal-free Pharma Syntheses Freeing PGM Capacity for Other Uses
- 4.3 Market Restraints
- 4.3.1 Persistent PGM Price Volatility and Supply Chain Shocks
- 4.3.2 Growing EV Penetration Reducing ICE Autocatalyst Volumes
- 4.3.3 Circular-economy Recycling Rates Rising Faster than Primary Demand
- 4.4 Value Chain Analysis
- 4.5 Porter's Five Forces
- 4.5.1 Threat of New Entrants
- 4.5.2 Bargaining Power of Suppliers
- 4.5.3 Bargaining Power of Buyers
- 4.5.4 Threat of Substitutes
- 4.5.5 Competitive Rivalry
5 Market Size and Growth Forecasts (Volume)
- 5.1 By Metal Type
- 5.1.1 Platinum
- 5.1.2 Palladium
- 5.1.3 Rhodium
- 5.1.4 Iridium
- 5.1.5 Ruthenium
- 5.1.6 Other Metal Types (Osmium, Gold, Silver)
- 5.2 By Catalyst Form
- 5.2.1 Powder
- 5.2.2 Pellet/Bead
- 5.2.3 Extrudate and Honeycomb
- 5.2.4 Wash coated Monolith
- 5.3 By Manufacturing Process
- 5.3.1 Incipient wetness Impregnation
- 5.3.2 Electroless and Electrochemical Deposition
- 5.3.3 Chemical Vapour / Atomic Layer Deposition
- 5.3.4 Sol-Gel / Precipitation
- 5.3.5 Other Advanced Nano structuring
- 5.4 By Application
- 5.4.1 Automotive
- 5.4.2 Phramaceutical
- 5.4.3 Petrochemicals
- 5.4.4 Other Applications (Electronics and Semiconductor, Fuel Cells, etc.)
- 5.5 By Geography
- 5.5.1 Asia-Pacific
- 5.5.1.1 China
- 5.5.1.2 Japan
- 5.5.1.3 India
- 5.5.1.4 South Korea
- 5.5.1.5 ASEAN Countries
- 5.5.1.6 Rest of Asia-Pacific
- 5.5.2 North America
- 5.5.2.1 United States
- 5.5.2.2 Canada
- 5.5.2.3 Mexico
- 5.5.3 Europe
- 5.5.3.1 Germany
- 5.5.3.2 United Kingdom
- 5.5.3.3 France
- 5.5.3.4 Italy
- 5.5.3.5 Rest of Europe
- 5.5.4 South America
- 5.5.4.1 Brazil
- 5.5.4.2 Argentina
- 5.5.4.3 Rest of South America
- 5.5.5 Middle-East and Africa
- 5.5.5.1 Saudi Arabia
- 5.5.5.2 South Africa
- 5.5.5.3 Rest of Middle-East and Africa
- 5.5.1 Asia-Pacific
6 Competitive Landscape
- 6.1 Market Concentration
- 6.2 Strategic Moves
- 6.3 Market Share(%)/Ranking Analysis
- 6.4 Company Profiles (includes Global level Overview, Market level overview, Core Segments, Financials as available, Strategic Information, Market Rank/Share for key companies, Products and Services, and Recent Developments)
- 6.4.1 ALS
- 6.4.2 American Elements
- 6.4.3 BASF
- 6.4.4 Catalytic Products International
- 6.4.5 CHIMET
- 6.4.6 Clariant
- 6.4.7 Evonik Industries AG
- 6.4.8 Heraeus Precious Metals
- 6.4.9 Honeywell International, Inc.
- 6.4.10 Kaili Catalyst New Materials Co., Ltd.
- 6.4.11 ReMetall Deutschland AG
- 6.4.12 Sabin Metal Corp.
- 6.4.13 Shaanxi kaida chemical co. LTD
- 6.4.14 Stanford Advanced Materials
- 6.4.15 Takasago International Corporation
- 6.4.16 TANAKA PRECIOUS METAL GROUP Co., Ltd.
- 6.4.17 Thermo Fisher Scientific Inc.
- 6.4.18 Umicore
- 6.4.19 Valterra Platinum Limited
7 Market Opportunities and Future Outlook
- 7.1 White-space and Unmet-need Assessment

