
PUBLISHER: Mordor Intelligence | PRODUCT CODE: 1850321

PUBLISHER: Mordor Intelligence | PRODUCT CODE: 1850321
Solid State Drive (SSD) - Market Share Analysis, Industry Trends & Statistics, Growth Forecasts (2025 - 2030)
The SSD market commands USD 61.30 billion in 2025 and is on course to touch USD 129.62 billion by 2030, advancing at a 16.16% CAGR.
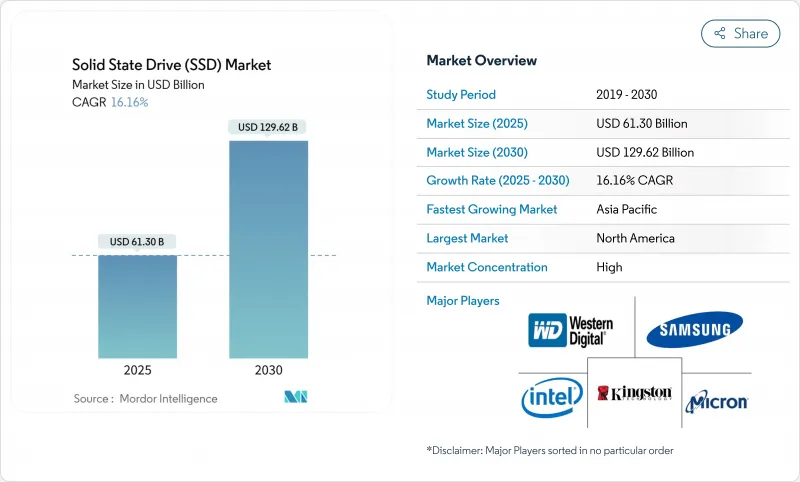
Sharply rising demand for enterprise AI training clusters, record hyperscaler capital outlays, and an ongoing migration from mechanical media toward high-performance solid-state arrays underpin this momentum. Vendors that combine high-layer NAND, advanced PCIe interfaces, and sophisticated thermal designs are positioned to benefit as data-center architects prioritise density, efficiency, and low latency. Pricing remains fluid because NAND producers now calibrate wafer starts and layer transitions to preserve margins, yet healthy demand signals enable them to pass through selective increases. Competitive intensity also rises; Chinese suppliers gain domestic share, prompting incumbents to accelerate high-capacity QLC offerings and service-oriented firmware updates.
Global Solid State Drive (SSD) Market Trends and Insights
Rapid NVMe and PCIe Gen4-5 Penetration in Data Centers
Enterprise architects move decisively toward NVMe because PCIe Gen4 and Gen5 lanes supply the bandwidth that AI accelerators and real-time analytics now require. Hyperscalers adopt EDSFF E1.S enclosures that fit up to 64 drives per 1U, lifting density tenfold versus legacy U.2 arrays while maintaining hot-swap serviceability. Meta, Microsoft, and other cloud operators standardise on the newer form factor to simplify fleet service and cooling. Yet thermal loads escalate; tests on consumer Gen5 drives such as Corsair's MP700 show shutdown within three minutes when cooling is inadequate, highlighting the importance of server chassis airflow. Firmware-based throttling for PCIe 6.0 is already in prototype, confirming that interface speed gains will only translate to application performance when heat budgets are proactively managed.
Cloud-Hyperscaler Build-outs Boosting SSD Demand
These cloud hyperscale projects translate directly into petabyte-scale SSD tenders because AI services require all-flash tiers to keep GPUs saturated. Transactional proof points emerge in enterprise settings as well: a Southeast Asian bank cut database latency by 60% by shifting to an all-NVMe fabric, while still meeting stringent RAID tolerance.Such case studies reinforce a preference for flash-only architectures, especially where consolidation lowers rack count and eases power scheduling.
NAND Supply-Chain and Price Volatility
Producers curtailed wafer starts throughout 2024 to arrest a prolonged price slide, then deliberately raised contract pricing by 15-20% in Q3 2024 to realign profitability. The cycle injects budgeting uncertainty for buyers that depend on predictable cost curves. Industry consolidation exacerbates swings: SK Hynix closed its USD 1.9 billion acquisition of Intel's NAND assets, concentrating output under fewer decision makers. China's YMTC simultaneously accelerates 232-layer QLC, pushing bit density to 19.8 Gb/mm2 even under export controls. Sudden alignment or misalignment between supply and hyperscale demand can therefore widen quarterly price bands and complicate long-range TCO planning.
Other drivers and restraints analyzed in the detailed report include:
- AI/ML Training Servers' Need for High-Endurance QLC and TLC
- Thermal Throttling and Power-Draw Challenges in PCIe Gen5
For complete list of drivers and restraints, kindly check the Table Of Contents.
Segment Analysis
M.2 preserved 42.70% of SSD market share in 2024 because its slim profile aligns with client devices and entry-level servers. EDSFF E1.S, however, is on track for a 16.9% CAGR through 2030 as cloud providers favor tool-less hot-swap sleds that fit denser racks while managing thermals. U.2 lingers where dual-port PCIe is mandatory, chiefly in financial trading hubs that prize HA topologies. E3.S variants enter pilot at hyperscalers that want PCIe 5.0 performance with EDSFF serviceability. Consumer boards continue to rely on M.2 because its absence of a caddy keeps BOM costs down, yet laptop OEMs already test CAMM and soldered BGA flash as QLC cost curves sink. Over the forecast period, enterprises will progressively widen procurement policies to include E1.S and, eventually, E3.S for Gen6 deployments.
Enterprise workloads held 45.1% of the SSD market size in 2024, yet AI-tuned deployments are slated to out-run broader enterprise storage, advancing at 17.5% annually. Financial analytics, risk modelling, and generative AI inference push storage architects to co-locate flash with accelerators, so rack plans now require fewer, larger drives to reduce cross-bar latency. The SSD market share for AI-optimised storage is set to exceed 30% by 2030 as GPUs proliferate across verticals.
Client devices still ship the largest unit volumes, but commoditisation suppresses margin. Smartphones adopt UFS 4.0 NAND that posts 4,200 MB/s reads, and thin-and-light laptops jump to 4TB modules as creators demand 8K project caches. Industrial controls and autonomous robots make up a small but growing niche; these applications run in -40 °C to 85 °C envelopes and expect 150k P/E cycles, so vendors like ATP Electronics leverage pSLC modes and ECC algorithms to satisfy extended duty requirements.
Solid State Drive is Segmented by Form Factor (2. 5-Inch, M. 2, and More), Application (Enterprise/Data-Center, Client/Consumer Devices, and More), Storage Capacity (less Than 1 TB, 1 - 2 TB, and Others), End-User Industry (Cloud Service Providers, Gaming and Esports, and More), by Geography. The Market Forecasts are Provided in Terms of Value (USD).
Geography Analysis
North America controlled 26.7% of 2024 revenue, a position built on dense hyperscaler campuses and early AI adoption in financial and healthcare domains. The SSD market size for North America is forecast to grow to USD 31.4 billion by 2030, but its mid-teens CAGR lags Asia-Pacific because the installed base is already large. Investment tax incentives and an abundant colocation ecosystem sustain new module rollouts and keep channel inventory balanced. Enterprises in the region emphasise data-sovereignty; as a result, operators deploy zonal storage clusters across multiple metropolitan campuses to tighten data-residency compliance.
Asia-Pacific exhibits the fastest CAGR at 18.2% thanks to Chinese, South Korean, and Japanese fabs that secure local supply even when export controls tighten. Four of the ten largest SSD brands are now Chinese, and together they captured 23% global unit share during Singles' Day 2024 promotions. Domestic hyperscalers such as Alibaba Cloud and Tencent Cloud integrate those drives into white-box servers, accelerating volume ramp. Government programmes offering tax holidays for semiconductor investments further stimulate bit output, and regional colocation players in India and Indonesia open new zones that pair domestic compute with low-latency storage.
Europe concentrates on carbon budgeting and circular-economy targets, so operators favour SSD lines with endurance analytics, power-loss protection, and verified recycling paths. Market growth remains healthy but modest because energy caps and site permitting slow hyperscale green-field builds. Instead, brown-field retrofits that replace HDDs with flash in existing shells form the bulk of shipments. Middle East data-center projects in Saudi Arabia and UAE add incremental upside, whereas Africa stays early in the adoption curve, with edge caching for telco applications as the first use case.
- Samsung Electronics Co. Ltd.
- Western Digital Corporation
- SK hynix Inc. (incl. Solidigm)
- Micron Technology Inc.
- Kioxia Holdings Corporation
- Seagate Technology LLC
- Kingston Technology Corporation
- ADATA Technology Co. Ltd.
- Transcend Information Inc.
- Crucial (Micron Consumer)
- Silicon Motion Technology Corp.
- Marvell Technology Group
- Phison Electronics Corp.
- Corsair Memory Inc.
- Patriot Memory LLC
- Team Group Inc.
- PNY Technologies Inc.
- G.SKILL International Enterprise
- Intel Corporation
- Sabrent
Additional Benefits:
- The market estimate (ME) sheet in Excel format
- 3 months of analyst support
TABLE OF CONTENTS
1 INTRODUCTION
- 1.1 Study Assumptions and Market Definition
- 1.2 Scope of the Study
2 RESEARCH METHODOLOGY
3 EXECUTIVE SUMMARY
4 MARKET LANDSCAPE
- 4.1 Market Overview
- 4.2 Market Drivers
- 4.2.1 Rapid NVMe and PCIe Gen4-5 penetration in data centers
- 4.2.2 Cloud-hyperscaler build-outs boosting SSD demand
- 4.2.3 OEM Integration in Smartphones and Tablets
- 4.2.4 NAND USD/GB decline widening addressable base
- 4.2.5 AI/ML training servers' need for high-endurance QLC and TLC
- 4.2.6 Edge-computing shift to hot-swappable E1.S / EDSFF
- 4.3 Market Restraints
- 4.3.1 SSD price premium over HDD in cold-storage tiers
- 4.3.2 NAND supply-chain and price volatility
- 4.3.3 Limited write-endurance versus HDD for archival use
- 4.3.4 Thermal throttling and power-draw challenges in PCIe Gen5
- 4.4 Supply-Chain Analysis
- 4.5 Regulatory Landscape
- 4.6 Technological Outlook
- 4.7 Porter's Five Force Analysis
- 4.7.1 Bargaining Power of Suppliers
- 4.7.2 Bargaining Power of Consumers
- 4.7.3 Threat of New Entrants
- 4.7.4 Threat of Substitute Products
- 4.7.5 Intensity of Competitive Rivalry
- 4.8 Assesment of Macroeconomic Factors on the Market
5 MARKET SIZE AND GROWTH FORECASTS (VALUE)
- 5.1 By Form Factor
- 5.1.1 2.5-inch
- 5.1.2 M.2
- 5.1.3 U.2
- 5.1.4 Others
- 5.2 By Application
- 5.2.1 Enterprise / Data-Center
- 5.2.2 Client / Consumer Devices
- 5.2.3 Industrial and Automotive
- 5.2.4 Others (Edge, Surveillance, IoT)
- 5.3 By Storage Capacity
- 5.3.1 Less than 1 TB
- 5.3.2 1 - 2 TB
- 5.3.3 Others
- 5.4 By End-user Industry
- 5.4.1 Cloud Service Providers
- 5.4.2 Gaming and Esports
- 5.4.3 Financial Services
- 5.4.4 Government and Defense
- 5.4.5 Others
- 5.5 By Geography
- 5.5.1 North America
- 5.5.1.1 United States
- 5.5.1.2 Canada
- 5.5.1.3 Mexico
- 5.5.2 South America
- 5.5.2.1 Brazil
- 5.5.2.2 Argentina
- 5.5.2.3 Colombia
- 5.5.3 Europe
- 5.5.3.1 Germany
- 5.5.3.2 United Kingdom
- 5.5.3.3 France
- 5.5.3.4 Italy
- 5.5.3.5 Spain
- 5.5.3.6 Rest of Europe
- 5.5.4 Asia-Pacific
- 5.5.4.1 China
- 5.5.4.2 Japan
- 5.5.4.3 South Korea
- 5.5.4.4 India
- 5.5.4.5 Taiwan
- 5.5.4.6 Rest of Asia-Pacific
- 5.5.5 Middle East and Africa
- 5.5.5.1 Middle East
- 5.5.5.1.1 Saudi Arabia
- 5.5.5.1.2 United Arab Emirates
- 5.5.5.1.3 Turkey
- 5.5.5.1.4 Rest of Middle East
- 5.5.5.2 Africa
- 5.5.5.2.1 South Africa
- 5.5.5.2.2 Nigeria
- 5.5.5.2.3 Egypt
- 5.5.5.2.4 Rest of Africa
- 5.5.1 North America
6 COMPETITIVE LANDSCAPE
- 6.1 Market Concentration
- 6.2 Strategic Moves
- 6.3 Market Share Analysis
- 6.4 Company Profiles (includes Global level Overview, Market level overview, Core Segments, Financials as available, Strategic Information, Market Rank/Share for key companies, Products and Services, and Recent Developments)
- 6.4.1 Samsung Electronics Co. Ltd.
- 6.4.2 Western Digital Corporation
- 6.4.3 SK hynix Inc. (incl. Solidigm)
- 6.4.4 Micron Technology Inc.
- 6.4.5 Kioxia Holdings Corporation
- 6.4.6 Seagate Technology LLC
- 6.4.7 Kingston Technology Corporation
- 6.4.8 ADATA Technology Co. Ltd.
- 6.4.9 Transcend Information Inc.
- 6.4.10 Crucial (Micron Consumer)
- 6.4.11 Silicon Motion Technology Corp.
- 6.4.12 Marvell Technology Group
- 6.4.13 Phison Electronics Corp.
- 6.4.14 Corsair Memory Inc.
- 6.4.15 Patriot Memory LLC
- 6.4.16 Team Group Inc.
- 6.4.17 PNY Technologies Inc.
- 6.4.18 G.SKILL International Enterprise
- 6.4.19 Intel Corporation
- 6.4.20 Sabrent
7 MARKET OPPORTUNITIES AND FUTURE OUTLOOK
- 7.1 White-space and Unmet-need Assessment

