
PUBLISHER: Mordor Intelligence | PRODUCT CODE: 1850323

PUBLISHER: Mordor Intelligence | PRODUCT CODE: 1850323
Optical Spectrum Analyzer (OSA) - Market Share Analysis, Industry Trends & Statistics, Growth Forecasts (2025 - 2030)
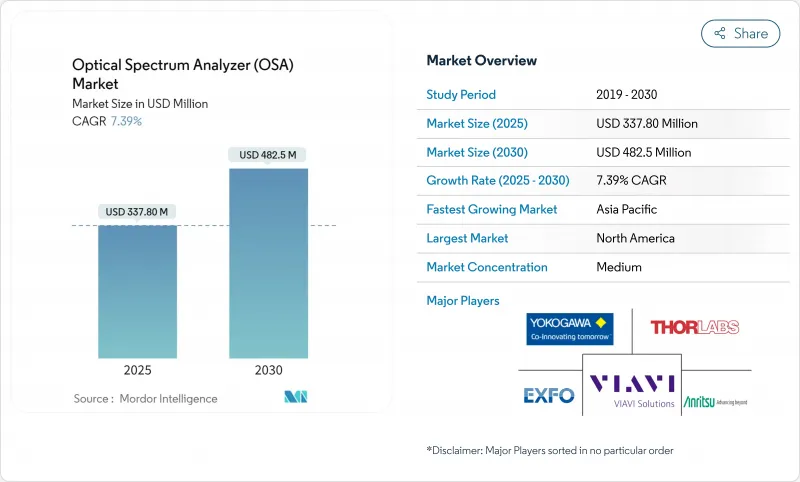
The optical spectrum analyzer market size is USD 337.8 million in 2025 and is set to reach USD 482.5 million by 2030, reflecting a steady 7.39% CAGR.
Uptake is accelerating as operators roll out 400 G and 800 G coherent links, data-center owners push toward tighter spectral margins, and 5G backhaul shifts to dense wavelength division multiplexing (DWDM). Field engineers now expect laboratory-grade resolution in the field, which is spurring rapid advances in miniaturization. Supply-chain volatility around gallium and germanium continues to squeeze component lead times, yet stricter optical-layer compliance rules in the United States and the European Union are compelling fresh test-equipment investment. Research funding in quantum optics and silicon photonics is widening the application base, encouraging vendors to blend high precision with AI-assisted analytics.
Global Optical Spectrum Analyzer (OSA) Market Trends and Insights
Expansion of 400/800 G Coherent Optical Networks
Installations of 400 G and 800 G coherent ports are rising sharply as cloud operators extend datacenter-interconnect footprints. Cignal AI expects 400 G pluggable port deployments to peak in 2026, followed by 800 G adoption.These higher-order modulation formats require sub-picometer resolution and low polarization-dependent loss, driving renewed demand for high-accuracy OSAs. Vendors are embedding faster coherent receivers, automated dispersion-compensation analytics, and broader sweep bandwidths to keep pace. As networks migrate toward 1.6 T interfaces, continuous-sweep instruments with real-time digital signal processing (DSP) become indispensable for validating optical signal-to-noise ratio (OSNR) under tighter channel spacing.
Roll-out of 5G/6G Fronthaul & Backhaul DWDM Links
DWDM now underpins 5G fronthaul in dense urban clusters, and early 6G field trials already demand channel granularity below 50 GHz. Research predicts mobile backhaul and fronthaul revenue to reach USD 56.34 billion by 2030, implying unprecedented optical-testing volume.OSAs calibrated for 1550 nm C-band channels are being supplemented with extended-range units that cover 1310 nm P2P fiber and free-space optics feeds. Operators favor handheld designs that integrate remote cloud dashboards, enabling immediate spectral snapshots during tower turn-ups. The optical spectrum analyzer market is seeing increased bundling with passive optical network (PON) power meters, creating one-stop diagnostic kits.
High capital and calibration cost of sub-pm resolution OSAs
Sub-picometer instruments often exceed USD 100,000 per unit and demand periodic factory calibration to maintain +-0.03 nm absolute accuracy. These recurring expenses deter smaller labs and network operators in price-sensitive regions. EXFO notes that maintaining +-0.5 dB power accuracy typically requires specialist recalibration services. Vendors are experimenting with subscription-based calibration programs and modular optics cartridges to lower ownership cost, yet adoption remains constrained among cost-conscious buyers, tempering growth in segments below 100 GHz channel spacing.
Other drivers and restraints analyzed in the detailed report include:
- Miniaturisation Enabling Field-Deployable OSAs
- Silicon Photonics and Quantum Optics R&D Funding Upsurge
- Alternative real-time spectrum monitoring (software-defined) solutions
For complete list of drivers and restraints, kindly check the Table Of Contents.
Segment Analysis
Benchtop units contributed to 70% of total revenue, in 2024, thanks to unmatched dynamic range and sweep resolution. High-end coherent network rollouts continue to rely on these laboratory-grade platforms for pre-deployment characterization and manufacturing QC. Yet the handheld segment is expanding at a 10.2% CAGR, nearly three percentage points above the overall optical spectrum analyzer market. The optical spectrum analyzer market size for handheld models is forecast to register a CAGR of 10,2%, propelled by MEMS-based gratings and GPU-accelerated signal reconstruction.
Portable designs integrate cloud-native dashboards, Wi-Fi backhaul, and AI-powered event annotation, letting field technicians upload traces directly into trouble-ticket systems. Computational spectrometers using pattern-encoded apertures now achieve 0.1 nm resolution in chassis weighing under 1 kg.Vendors also push hybrid "portable-bench" instruments delivering benchtop-level accuracy in a rugged case, widening mid-tier adoption. These shifts indicate a long-run balancing act between resolution, budget, and mobility across the optical spectrum analyzer market.
Spectrometer mode generated 65% of revenue, because it delivers a full view of power spectral density across C- and L-bands. As DWDM channel counts rise, engineers increasingly pair spectrometer sweeps with real-time wavelength-meter snapshots to catch drift under load. Wavelength-meter products, now growing at 9.1% annually, combine stabilized Fabry-Perot references with fast photodiode arrays, producing +-0.01 nm accuracy within 200 ms.
Optical channel turn-up often begins with a wavelength-meter check before deeper spectrometer analysis, a workflow that is fostering dual-mode instruments. Keysight's recent tester embeds both measurement paths, adding AI-driven pass-fail analytics that trim certification time. The optical spectrum analyzer industry is likely to see further convergence, as algorithmic techniques compensate for missing detector elements, compressing cost while maintaining precision.
The Optical Spectrum Analyzer Market Report is Segmented by Type (Portable, Handheld, and Benchtop), Mode Type (Spectrometer Mode, and Wavelength Meter Mode), Wavelength Range (400-700 Nm (Visible), 700-1700 Nm (Near-IR), and 1700-2400 Nm (SWIR)), End-User Industry (Telecommunication Operators and OEMs, Consumer Electronics and Photonics Devices, and More), and Geography. The Market Forecasts are Provided in Terms of Value (USD).
Geography Analysis
North America contributed 33% of revenue in 2024, anchored by dense hyperscale datacenter clusters and federally backed quantum-research hubs. Regulatory mandates that embed optical-layer compliance in 800 G transceivers reinforce procurement momentum, while Ciena's 8192 coherent router launch further stimulates demand for inline spectral verification. Regional manufacturers also benefit from reshoring incentives designed to de-risk component supply.
Asia Pacific shows the fastest trajectory, advancing at an 8.9% CAGR to 2030. Massive 5G rollouts, rising photonic-chip foundry capacity, and national programs such as "Made in China 2025" are propelling local spending on high-precision test gear. The optical spectrum analyzer market size for Asia Pacific is projected to grow rapidly by 2030 as carriers densify backhaul networks and universities escalate PIC research.
Europe maintains strong standing through concerted R&D funding, eco-design regulations, and integrated photonics clusters in the Netherlands and Germany. Strict carbon-reduction goals push operators to adopt energy-efficient coherent optics, a move that requires meticulous spectral balancing during deployment. Momentum also builds in the Middle East, Africa, and South America, where greenfield fiber projects leapfrog older copper infrastructure. While spending is smaller, high initial equipment orders accompany each network phase, expanding the global optical spectrum analyzer market footprint.
- Yokogawa Test and Measurement Corp.
- Keysight Technologies Inc.
- VIAVI Solutions Inc.
- EXFO Inc.
- Anritsu Corp.
- Thorlabs Inc.
- Coherent (II-VI Inc.)
- Luna Innovations Inc.
- Quantifi Photonics Ltd.
- Apex Technologies
- Aragon Photonics Labs
- ID Photonics GmbH
- VeEX Inc.
- Timbercon Inc.
- Optoplex Corp.
- AMS Technologies AG
- Bristol Instruments Inc.
- Advanced Photonix (Luna)
- Finisar Corp.
- Spectris PLC
Additional Benefits:
- The market estimate (ME) sheet in Excel format
- 3 months of analyst support
TABLE OF CONTENTS
1 INTRODUCTION
- 1.1 Study Assumptions and Market Definition
- 1.2 Scope of the Study
2 RESEARCH METHODOLOGY
3 EXECUTIVE SUMMARY
4 MARKET LANDSCAPE
- 4.1 Market Overview
- 4.2 Market Drivers
- 4.2.1 Expansion of 400/800 G Coherent Optical Networks
- 4.2.2 Roll-out of 5G/6G Fronthaul and Backhaul DWDM Links
- 4.2.3 Miniaturisation Enabling Field-Deployable OSAs
- 4.2.4 Silicon Photonics and Quantum Optics R&D Funding Upsurge
- 4.2.5 Mandatory Optical-Layer Compliance in Data-Centre Transceivers (United States and EU)
- 4.3 Market Restraints
- 4.3.1 High Capital and Calibration Cost of Sub-pm Resolution OSAs
- 4.3.2 Performance Limits of Handheld Units for Coherent Systems
- 4.3.3 Alternative Real-time Spectrum Monitoring (SWI-based) Solutions
- 4.3.4 Tariff-Driven Photonic Component Supply-Chain Volatility
- 4.4 Industry Ecosystem Analysis
- 4.5 Technological Outlook
- 4.6 Porter's Five Forces Analysis
- 4.6.1 Threat of New Entrants
- 4.6.2 Bargaining Power of Buyers
- 4.6.3 Bargaining Power of Suppliers
- 4.6.4 Threat of Substitutes
- 4.6.5 Intensity of Rivalry
5 MARKET SIZE AND GROWTH FORECASTS (VALUES)
- 5.1 By Type
- 5.1.1 Portable
- 5.1.2 Handheld
- 5.1.3 Benchtop
- 5.2 By Mode Type
- 5.2.1 Spectrometer Mode
- 5.2.2 Wavelength Meter Mode
- 5.3 By Wavelength Range
- 5.3.1 400-700 nm (Visible)
- 5.3.2 700-1700 nm (Near-IR)
- 5.3.3 1700-2400 nm (SWIR)
- 5.4 By End-user Industry
- 5.4.1 Telecommunication Operators and OEMs
- 5.4.2 Healthcare and Life-Sciences Instrumentation
- 5.4.3 Consumer Electronics and Photonics Devices
- 5.4.4 Industrial and Manufacturing QA/QC
- 5.4.5 Aerospace and Defence Optoelectronics
- 5.4.6 Academic and Government Research Labs
- 5.5 By Geography
- 5.5.1 North America
- 5.5.1.1 United States
- 5.5.1.2 Canada
- 5.5.1.3 Mexico
- 5.5.2 Europe
- 5.5.2.1 Germany
- 5.5.2.2 United Kingdom
- 5.5.2.3 France
- 5.5.2.4 Italy
- 5.5.2.5 Spain
- 5.5.2.6 Rest of Europe
- 5.5.3 Asia-Pacific
- 5.5.3.1 China
- 5.5.3.2 Japan
- 5.5.3.3 South Korea
- 5.5.3.4 India
- 5.5.3.5 South East Asia
- 5.5.3.6 Rest of Asia-Pacific
- 5.5.4 South America
- 5.5.4.1 Brazil
- 5.5.4.2 Rest of South America
- 5.5.5 Middle East and Africa
- 5.5.5.1 Middle East
- 5.5.5.1.1 United Arab Emirates
- 5.5.5.1.2 Saudi Arabia
- 5.5.5.1.3 Rest of Middle East
- 5.5.5.2 Africa
- 5.5.5.2.1 South Africa
- 5.5.5.2.2 Rest of Africa
- 5.5.1 North America
6 COMPETITIVE LANDSCAPE
- 6.1 Market Concentration
- 6.2 Strategic Moves
- 6.3 Market Share Analysis
- 6.4 Company Profiles (includes Global level Overview, Market level overview, Core Segments, Financials as available, Strategic Information, Market Rank/Share for key companies, Products and Services, and Recent Developments)
- 6.4.1 Yokogawa Test and Measurement Corp.
- 6.4.2 Keysight Technologies Inc.
- 6.4.3 VIAVI Solutions Inc.
- 6.4.4 EXFO Inc.
- 6.4.5 Anritsu Corp.
- 6.4.6 Thorlabs Inc.
- 6.4.7 Coherent (II-VI Inc.)
- 6.4.8 Luna Innovations Inc.
- 6.4.9 Quantifi Photonics Ltd.
- 6.4.10 Apex Technologies
- 6.4.11 Aragon Photonics Labs
- 6.4.12 ID Photonics GmbH
- 6.4.13 VeEX Inc.
- 6.4.14 Timbercon Inc.
- 6.4.15 Optoplex Corp.
- 6.4.16 AMS Technologies AG
- 6.4.17 Bristol Instruments Inc.
- 6.4.18 Advanced Photonix (Luna)
- 6.4.19 Finisar Corp.
- 6.4.20 Spectris PLC
7 MARKET OPPORTUNITIES AND FUTURE OUTLOOK
- 7.1 White-space and Unmet-Need Assessment

