
PUBLISHER: Mordor Intelligence | PRODUCT CODE: 1850324

PUBLISHER: Mordor Intelligence | PRODUCT CODE: 1850324
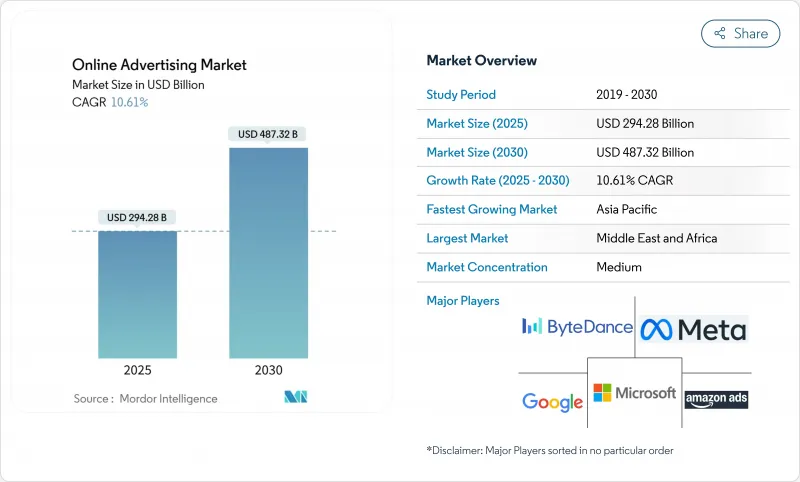
Online Advertising - Market Share Analysis, Industry Trends & Statistics, Growth Forecasts (2025 - 2030)
The online advertising market size stands at USD 294.28 billion in 2025 and is projected to reach USD 487.32 billion by 2030, reflecting a 10.61% compound annual growth rate (CAGR) over 2025-2030.
The online advertising market continues to monetise emerging touchpoints despite stricter privacy rules and uneven macroeconomic signals. Advertisers keep digital budgets intact because impression-level reporting clarifies working-capital deployment, while publishers rebalance inventory toward higher-yield short-form video and commerce-linked display that sustain revenue even when raw impressions stabilise. Growth also benefits from a rising cohort of medium-sized brands that buy programmatically through self-serve tools, spreading spend more evenly rather than relying on a small group of multinationals. Simultaneously, regional diversification secures the online advertising market because incremental outlay is coming from Latin America, the Middle East, and Africa as smartphone adoption rises, reducing exposure to single-region slowdowns.
Global Online Advertising Market Trends and Insights
Retail media networks accelerate closed-loop measurement
Retailers wielding authenticated transaction data now operate in-house ad networks that let consumer-goods brands verify sales lift directly, raising confidence in the online advertising market. A 2024 securities filing by the largest e-commerce marketplace showed on-platform ad spend climbing faster than gross merchandise volume, signalling a strong appetite for data-rich placements . Mid-tier U.S. grocery chains followed with media networks that delivered double-digit return-on-ad-spend gains versus open-web banners. As attribution occurs inside the same checkout environment, marketers recycle budget rapidly toward top-performing SKUs, and loyalty-centric pharmacy chains plan similar sponsored search shelves in 2025, broadening the model.
AI-generated dynamic creative optimisation compresses production cycles
Major platforms deployed real-time rendering engines in 2024, enabling advertisers to upload a core asset library that algorithms remix according to viewer attributes. A European flag-carrier airline reported measurable booking-intent gains within four weeks of personalised creatives, then applied the tactic to upsell units such as seat upgrades. In 2025 a consumer-electronics brand stated that AI-based video variants multiplied creative output fivefold while matching brand-safety scores. As creative volume ceases to constrain testing, extra response signals feed platform recommendations, improving relevance without new data collection.
European signal loss from cookie deprecation forces contextual renaissance
Google Sandbox tests in 2024 indicated revenue loss when display inventory lacked third-party cookies . A German publisher expanded to 15,000 contextual segments and recovered half the lost CPM by Q1 2025. Advertisers pivot to semantic alignment, reviving premium editorial environments and partly reversing earlier movement toward user-generated content.
Other drivers and restraints analyzed in the detailed report include:
- 5G unlocks immersive video across South-East Asia
- Commerce-search convergence inside super-apps fuels in-app placements
- Digital-services taxes pressure platform and advertiser margins
For complete list of drivers and restraints, kindly check the Table Of Contents.
Segment Analysis
Video advertising currently logs the fastest growth within the online advertising market size, climbing at a mid-teen CAGR while other formats mature. Short-form vertical clips and live-stream shopping overlays shorten the path from impression to purchase in one viewing session. Streaming sports rights holders added picture-in-picture wagering prompts during the 2024 playoffs, and dashboards showed extended dwell times among core fans. As brands observe higher completion rates versus skippable formats, spend shifts toward inventory that justifies premium pricing. The online advertising market benefits because publishers can package fewer but more valuable impressions. Display banners, though steadier, evolve into programmatic digital-out-of-home screens that react to weather or commuter flows, maintaining relevance outside desktop environments.
Search advertising protects its commanding place by converting intent signals into performance, yet its growth curve flattens as query volume decelerates. Engines now embed generative overviews that mix organic answers with sponsored placements, and click-path studies in early 2025 showed deeper scrolling, effectively expanding paid real estate. This adjustment keeps search a cash generator within the online advertising market, even as display and social formats innovate. Meanwhile, contextual display and out-of-home linkages prove that banner evolution can secure new budgets rather than cannibalise existing ones.
Online Advertising Market is Segmented by Advertising Format (Social Media, Search Engine, and More), Platform (Mobile, Desktop and Laptop, and Other Platforms), End-User Vertical (Automotive, Retail and E-Commerce, and More), and Geography. The Market Forecasts are Provided in Terms of Value (USD).
Geography Analysis
Asia-Pacific commands roughly 34% of global spend, underpinned by mobile-first populations and super-app ecosystems. Live-commerce festivals in China register billions of micro-interactions that convert inside the same short-video clip, reinforcing the region's primacy in the online advertising market. India's extension of the Unified Payments Interface to feature phones promises addressable advertising in rural districts previously out of reach. Indonesian and Malaysian telcos are rolling out tiered 5G packages, creating low-latency inventory that sustains growth without lowering price floors, positioning the region for incremental share.
North America preserves the highest revenue per user, benefitting from sophisticated auction tooling and a mature hybrid-TV ecosystem. Streaming households now form the majority of under-35 viewers, and a ratings-agency update in early 2025 merged linear and digital reach on a single currency line, simplifying cross-screen buys. Retailers extend in-store digital displays that double as demand-side platform endpoints, letting advertisers geofence campaigns around specific store clusters and then reconcile sales via loyalty IDs. This fusion underpins premium CPMs and keeps North America central to the online advertising market.
The Middle East and Africa, while starting from a lower base, shows sustained double-digit CAGR as youthful demographics combine with expanding under-sea fibre. Government-backed smart-city projects integrate programmatic billboards that receive dynamic creative from central ad exchanges, creating an addressable surface unique to the region. Content creators monetise in Arabic, English, and French, and platforms report that multilingual targeting lifts relevance scores. Tourism recovery further boosts hospitality spend; Gulf airlines ran city-specific retargeting flights in early 2025 that filled shoulder-season routes, demonstrating cross-border scalability for the online advertising market.
- Google LLC
- Meta Platforms Inc.
- Amazon.com Inc. (Amazon Ads)
- ByteDance Ltd. (TikTok)
- Microsoft Corp. (LinkedIn, Bing Ads)
- Alibaba Group (Alimama)
- Tencent Holdings Ltd. (WeChat, Tencent Ads)
- Baidu Inc.
- Snap Inc.
- Pinterest Inc.
- X Corp. (Twitter)
- Spotify Technology S.A.
- Roku Inc.
- Comcast Corp. (FreeWheel)
- Samsung Ads
- Verizon Media (Yahoo)
- Adobe Inc.
- Oracle Advertising
- The Trade Desk Inc.
- Magnite Inc.
- Criteo S.A.
- Taboola Inc.
- PubMatic Inc.
Additional Benefits:
- The market estimate (ME) sheet in Excel format
- 3 months of analyst support
TABLE OF CONTENTS
1 INTRODUCTION
- 1.1 Study Assumptions and Market Definition
- 1.2 Scope of the Study
2 RESEARCH METHODOLOGY
3 EXECUTIVE SUMMARY
4 MARKET LANDSCAPE
- 4.1 Market Overview
- 4.2 Market Drivers
- 4.2.1 Retail Media Networks Monetization Driving Closed-Loop ROAS for CPG Brands
- 4.2.2 AI-Generated Dynamic Creative Optimisation Reducing CPA in North America
- 4.2.3 5G-Enabled Immersive Video Ads Accelerating Spend in South-East Asia
- 4.2.4 Commerce-Search Integration in Super-Apps Fueling In-App Ads Across China and SEA
- 4.3 Market Restraints
- 4.3.1 Signal-Loss from Third-Party-Cookie Deprecation in EU Undermining Targeting
- 4.3.2 Digital-Services Taxes in UK and France Squeezing Platform Margins
- 4.4 Regulatory Outlook
- 4.5 Technological Outlook (AI, Privacy Sandbox, Clean Rooms)
- 4.6 Porter's Five Forces Analysis
- 4.6.1 Threat of New Entrants
- 4.6.2 Bargaining Power of Suppliers
- 4.6.3 Bargaining Power of Buyers
- 4.6.4 Threat of Substitutes
- 4.6.5 Intensity of Rivalry
5 MARKET SIZE AND GROWTH FORECASTS (VALUE)
- 5.1 By Advertising Format
- 5.1.1 Social Media
- 5.1.2 Search Engine
- 5.1.3 Video
- 5.1.4 Email
- 5.1.5 Other Advertising Formats
- 5.2 By Platform
- 5.2.1 Mobile
- 5.2.2 Desktop and Laptop
- 5.2.3 Other Platforms
- 5.3 By End-user Vertical
- 5.3.1 Automotive
- 5.3.2 Retail and E-commerce
- 5.3.3 Healthcare and Pharma
- 5.3.4 BFSI
- 5.3.5 Telecom
- 5.3.6 Other Verticals
- 5.4 By Geography
- 5.4.1 North America
- 5.4.1.1 United States
- 5.4.1.2 Canada
- 5.4.1.3 Mexico
- 5.4.2 South America
- 5.4.2.1 Brazil
- 5.4.2.2 Argentina
- 5.4.2.3 Rest of South America
- 5.4.3 Europe
- 5.4.3.1 Germany
- 5.4.3.2 United Kingdom
- 5.4.3.3 France
- 5.4.3.4 Italy
- 5.4.3.5 Spain
- 5.4.3.6 Rest of Europe
- 5.4.4 Asia-Pacific
- 5.4.4.1 China
- 5.4.4.2 Japan
- 5.4.4.3 South Korea
- 5.4.4.4 India
- 5.4.4.5 Australia
- 5.4.4.6 New Zealand
- 5.4.4.7 Rest of Asia-Pacific
- 5.4.5 Middle East and Africa
- 5.4.5.1 United Arab Emirates
- 5.4.5.2 Saudi Arabia
- 5.4.5.3 South Africa
- 5.4.5.4 Rest of Middle East and Africa
- 5.4.1 North America
6 COMPETITIVE LANDSCAPE
- 6.1 Strategic Developments
- 6.2 Vendor Positioning Analysis
- 6.3 Company Profiles (includes Global level Overview, Market level overview, Core Segments, Financials as available, Strategic Information, Products and Services, and Recent Developments)
- 6.3.1 Google LLC
- 6.3.2 Meta Platforms Inc.
- 6.3.3 Amazon.com Inc. (Amazon Ads)
- 6.3.4 ByteDance Ltd. (TikTok)
- 6.3.5 Microsoft Corp. (LinkedIn, Bing Ads)
- 6.3.6 Alibaba Group (Alimama)
- 6.3.7 Tencent Holdings Ltd. (WeChat, Tencent Ads)
- 6.3.8 Baidu Inc.
- 6.3.9 Snap Inc.
- 6.3.10 Pinterest Inc.
- 6.3.11 X Corp. (Twitter)
- 6.3.12 Spotify Technology S.A.
- 6.3.13 Roku Inc.
- 6.3.14 Comcast Corp. (FreeWheel)
- 6.3.15 Samsung Ads
- 6.3.16 Verizon Media (Yahoo)
- 6.3.17 Adobe Inc.
- 6.3.18 Oracle Advertising
- 6.3.19 The Trade Desk Inc.
- 6.3.20 Magnite Inc.
- 6.3.21 Criteo S.A.
- 6.3.22 Taboola Inc.
- 6.3.23 PubMatic Inc.
7 MARKET OPPORTUNITIES AND FUTURE OUTLOOK
- 7.1 White-Space and Unmet-Need Assessment

