
PUBLISHER: Mordor Intelligence | PRODUCT CODE: 1850370

PUBLISHER: Mordor Intelligence | PRODUCT CODE: 1850370
Sensor Fusion - Market Share Analysis, Industry Trends & Statistics, Growth Forecasts (2025 - 2030)
The sensor fusion market size is estimated at USD 8.75 billion in 2025 and is set to reach USD 18.22 billion by 2030, expanding at a 15.8% CAGR.
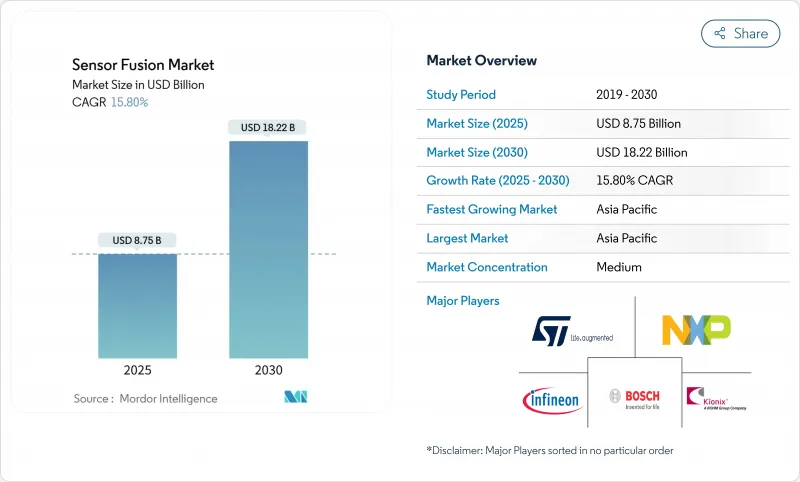
Growth rests on the need for reliable, real-time perception in autonomous systems, tighter safety regulations, and steady cost declines in key hardware such as solid-state LiDAR. Asia-Pacific leads adoption on the back of China's rapid rollout of autonomous vehicle (AV) testing routes and industrial automation projects. Europe's safety-first policies and the United States' V2X infrastructure investments provide additional momentum. Hardware still dominates revenue, yet software is capturing a rising share of value as edge AI shifts compute from the cloud to the endpoint, trimming latency and data-privacy risk. Radar-camera fusion is currently the workhorse configuration, but three-sensor suites that add LiDAR are scaling fastest and reshaping competitive positioning as component prices fall.
Global Sensor Fusion Market Trends and Insights
Mandate of Sensor Fusion for Euro NCAP 5-Star Ratings Accelerating European OEM Adoption
Euro NCAP's 2025 roadmap elevates multi-sensor perception to a non-negotiable safety baseline for European automakers. Passenger-car platforms must harmonize cameras, radar, and increasingly LiDAR to pass demanding pedestrian detection tests in both daylight and darkness. Converging policies by NHTSA in the United States reinforce global alignment, enabling suppliers to amortize development across regions. Tier-1s such as Aptiv respond with over-the-air-upgradable ADAS stacks that lower latency and sharpen object detection in cluttered urban scenes. The regulatory push accelerates software innovation because algorithm upgrades deliver measurable safety gains without re-engineering hardware.
Solid-State LiDAR Cost Decline Enabling Multi-Sensor Suites in Mid-Segment Cars across China
Unit prices for automotive-grade solid-state LiDAR have fallen roughly 99.5% from early commercial levels, making three-sensor fusion suites viable in China's sprawling mid-market segment. In 2025, 94 domestic vehicle models ship with LiDAR, double the prior year. Beijing's April 2025 L3 framework further catalyses demand, letting OEMs monetize higher autonomy through ride-hailing and personal-use programs. Local suppliers Hesai and RoboSense trail only Huawei in China's LiDAR revenue ranking, reinforcing a fiercely price-competitive environment that speeds global cost compression.
Lack of Uniform Fusion Architecture Standards Hindering Interoperability
Without common data formats and validation frameworks, OEMs and suppliers design bespoke fusion pipelines, elevating integration cost and hindering component interchangeability. NIST calls for standardized reference datasets and evaluation metrics to accelerate cross-vendor compatibility. Fragmentation also complicates automotive homologation because evidence collected on one platform may not transfer to another, slowing feature rollouts across model lines.
Other drivers and restraints analyzed in the detailed report include:
- Edge-AI Chip Advancements Allowing Real-Time Multi-Modal Fusion in Mobile and XR Devices
- Deployment of AMR Robots in Smart Factories Demanding High-Accuracy Sensor Fusion
- Data-Privacy and Cyber-Security Concerns Around Cloud-Aided Sensor Fusion Pipelines
For complete list of drivers and restraints, kindly check the Table Of Contents.
Segment Analysis
The sensor fusion market size for hardware stood at USD 5.7 billion in 2024, equal to 65% of total spending, underscoring the indispensable role of cameras, radar, LiDAR, and IMUs in perception. Hardware growth continues as vehicles exceed 30 discrete sensors, yet price erosion tempers revenue expansion. The software slice, by contrast, is scaling at an 18.9% CAGR to 2030 as OTA updates unlock new revenue stages post-sale, a shift already evident in Aptiv's Gen 6 ADAS rollouts.
Sophisticated fusion algorithms elevate installed hardware performance, yielding margin-rich upgrades without physical changes. CEVA's FSP201 sensor hub MCU illustrates the trend: a single low-power chip fuses inertial, audio, and environmental data for drones and wearables, signalling how optimized code will keep lifting the sensor fusion market for years to come.
Radar-camera systems controlled 38% of sensor fusion market share in 2024, balancing cost and robustness against poor weather. Most L2 ADAS stacks rely on this pairing for adaptive cruise control and automatic braking. The sensor fusion market size tied to three-sensor platforms is predicted to surge, however, on a 22.5% CAGR through 2030 as solid-state LiDAR prices tumble.
Integrating LiDAR enhances depth accuracy and redundancy, critical for L3 and above autonomy. Kyocera's camera-LiDAR fusion sensor collapses two modalities into one housing, reducing parallax while simplifying calibration demands. This packaging efficiency is vital for cost-sensitive segments where space and heat budgets are tight.
Sensor Fusion Market Sensor Fusion Market Segmented by Offering (Hardware, Software), Fusion Method (Radar + Camera Fusion, Lidar + Camera Fusion and More), Algorithm Type (Kalman Filter (EKF, UKF), Bayesian Networks and More), Application, Vehicle Type and Geography. The Market Forecasts are Provided in Terms of Value (USD).
Geography Analysis
Asia-Pacific controls the largest slice of the sensor fusion market, reaching USD 3.3 billion in 2024 and advancing on a 17.2% CAGR. China's 50-plus AV test zones, alongside national subsidies for industrial robotics, create scale. Japan and South Korea contribute miniaturized sensor know-how that feeds global supply chains. The sensor fusion market size in North America trails but benefits from Silicon Valley's deep AI talent pool and the U.S. push to embed V2X radios in highway corridors, a prerequisite for L4 perception redundancy.
Europe's direction is set by stringent safety and data-privacy rules. The region's Tier-1 suppliers leverage precision engineering to meet Euro NCAP's multi-sensor demands, keeping European platforms ahead on functional-safety metrics. Across the Middle East, defense modernization fuels multi-sensor targeting systems; these projects often birth dual-use IP that later migrates into civilian AVs. Africa and South America lag due to limited LiDAR penetration and less mature data infrastructure, but pockets of smart-city funding are piloting sensor fusion for traffic management and public-safety drones.
Collectively, regional regulatory frameworks, from Beijing's AV decree to Brussels' AI Act, dictate the pace and depth of sensor fusion rollouts. Suppliers accustomed to cross-continent homologation processes are turning regulatory variance into service revenue by offering certification toolchains bundled with their perception stacks.
- Robert Bosch GmbH
- Continental AG
- NXP Semiconductors N.V.
- STMicroelectronics N.V.
- Infineon Technologies AG
- Texas Instruments Inc.
- Nvidia Corporation
- Qualcomm Incorporated
- Analog Devices Inc.
- Mobileye Global Inc.
- Aptiv PLC
- Renesas Electronics Corporation
- Valeo S.A.
- ZF Friedrichshafen AG
- Arbe Robotics Ltd.
- BASELABS GmbH
- LeddarTech Inc.
- TDK Corporation
- Kionix Inc. (ROHM)
- Memsic Inc.
- CEVA Inc.
- AMD Xilinx
Additional Benefits:
- The market estimate (ME) sheet in Excel format
- 3 months of analyst support
TABLE OF CONTENTS
1 INTRODUCTION
- 1.1 Study Assumptions and Market Definition
- 1.2 Scope of the Study
2 RESEARCH METHODOLOGY
3 EXECUTIVE SUMMARY
4 MARKET LANDSCAPE
- 4.1 Market Overview
- 4.2 Market Drivers
- 4.2.1 Mandate of Sensor Fusion for Euro NCAP 5-Star Ratings Accelerating European OEM Adoption
- 4.2.2 Solid-State LiDAR Cost Decline Enabling Multi-Sensor Suites in Mid-Segment Cars across China
- 4.2.3 Edge-AI Chip Advancements Allowing Real-time Multi-Modal Fusion in Mobile and XR Devices
- 4.2.4 Deployment of AMR Robots in Smart Factories Demanding High-Accuracy Sensor Fusion
- 4.2.5 Defense Modernization Programs Funding Multi-Sensor Targeting and Navigation Systems in Middle East
- 4.2.6 Integration of V2X Data Streams into Fusion Stacks to Unlock L4 Autonomous Driving in the US
- 4.3 Market Restraints
- 4.3.1 Lack of Uniform Fusion Architecture Standards Hindering Interoperability
- 4.3.2 High Computational Overhead Raising BoM for Non-Automotive IoT Devices
- 4.3.3 Limited LiDAR Penetration in Emerging Markets Restricts Multi-Modal Fusion Adoption
- 4.3.4 Data-Privacy and Cyber-Security Concerns Around Cloud-Aided Sensor Fusion Pipelines
- 4.4 Value / Supply-Chain Analysis
- 4.5 Regulatory or Technological Outlook
- 4.5.1 Technology Evolution Roadmap for Multi-Sensor Fusion Platforms
- 4.5.2 Edge-AI Integration and SoC Advancements
- 4.6 Porter's Five Forces Analysis
- 4.6.1 Bargaining Power of Suppliers
- 4.6.2 Bargaining Power of Buyers/Consumers
- 4.6.3 Threat of New Entrants
- 4.6.4 Threat of Substitute Products
- 4.6.5 Intensity of Competitive Rivalry
- 4.7 Key Market Trends
- 4.7.1 Key Patents and Research Activities
- 4.7.2 Major and Emerging Applications
- 4.7.2.1 Adaptive Cruise Control (ACC)
- 4.7.2.2 Autonomous Emergency Braking (AEB)
- 4.7.2.3 Electronic Stability Control (ESC)
- 4.7.2.4 Forward Collision Warning (FCW)
- 4.7.2.5 Other Emerging Applications
- 4.8 Investment Landscape
5 MARKET SIZE AND GROWTH FORECASTS (VALUE)
- 5.1 By Offering
- 5.1.1 Hardware
- 5.1.2 Software
- 5.2 By Fusion Method
- 5.2.1 Radar + Camera Fusion
- 5.2.2 LiDAR + Camera Fusion
- 5.2.3 Radar + LiDAR Fusion
- 5.2.4 IMU + GPS Fusion
- 5.2.5 3-Sensor Fusion (Camera + Radar + LiDAR)
- 5.3 By Algorithm Type
- 5.3.1 Kalman Filter (EKF, UKF)
- 5.3.2 Bayesian Networks
- 5.3.3 Neural Network / Deep Learning
- 5.3.4 GNSS/INS Integration
- 5.4 By Application
- 5.4.1 Advanced Driver Assistance Systems (ADAS)
- 5.4.1.1 ACC
- 5.4.1.2 AEB
- 5.4.1.3 ESC
- 5.4.1.4 FCW
- 5.4.1.5 Lane-Keep Assist (LKA)
- 5.4.2 Autonomous Driving (Level 3-5)
- 5.4.3 Consumer Electronics (AR/VR, Smartphones, Wearables)
- 5.4.4 Robotics and Drones
- 5.4.5 Industrial Automation and Smart Manufacturing
- 5.4.6 Defense and Aerospace
- 5.4.1 Advanced Driver Assistance Systems (ADAS)
- 5.5 By Vehicle Type
- 5.5.1 Passenger Cars
- 5.5.2 Light Commercial Vehicles
- 5.5.3 Heavy Commercial Vehicles
- 5.5.4 Other Autonomous Vehicles (Shuttles, AGVs)
- 5.6 By Geography
- 5.6.1 North America
- 5.6.1.1 United States
- 5.6.1.2 Canada
- 5.6.1.3 Mexico
- 5.6.1.4 Caribbeans
- 5.6.2 Europe
- 5.6.2.1 Germany
- 5.6.2.2 United Kingdom
- 5.6.2.3 France
- 5.6.2.4 Italy
- 5.6.2.5 Spain
- 5.6.2.6 Rest of Europe
- 5.6.3 Asia-Pacific
- 5.6.3.1 China
- 5.6.3.2 Japan
- 5.6.3.3 South Korea
- 5.6.3.4 India
- 5.6.3.5 Rest of Asia-Pacific
- 5.6.4 South America
- 5.6.4.1 Brazil
- 5.6.4.2 Argentina
- 5.6.4.3 Rest of South America
- 5.6.5 Middle East
- 5.6.5.1 Saudi Arabia
- 5.6.5.2 United Arab Emirates
- 5.6.5.3 Israel
- 5.6.5.4 Turkey
- 5.6.5.5 Rest of Middle East
- 5.6.6 Africa
- 5.6.6.1 South Africa
- 5.6.6.2 Nigeria
- 5.6.6.3 Egypt
- 5.6.6.4 Rest of Africa
- 5.6.1 North America
6 COMPETITIVE LANDSCAPE
- 6.1 Market Concentration
- 6.2 Strategic Moves
- 6.3 Market Share Analysis
- 6.4 Company Profiles (includes Global level Overview, Market level overview, Core Segments, Financials as available, Strategic Information, Market Rank/Share for key companies, Products and Services, and Recent Developments)
- 6.4.1 Robert Bosch GmbH
- 6.4.2 Continental AG
- 6.4.3 NXP Semiconductors N.V.
- 6.4.4 STMicroelectronics N.V.
- 6.4.5 Infineon Technologies AG
- 6.4.6 Texas Instruments Inc.
- 6.4.7 Nvidia Corporation
- 6.4.8 Qualcomm Incorporated
- 6.4.9 Analog Devices Inc.
- 6.4.10 Mobileye Global Inc.
- 6.4.11 Aptiv PLC
- 6.4.12 Renesas Electronics Corporation
- 6.4.13 Valeo S.A.
- 6.4.14 ZF Friedrichshafen AG
- 6.4.15 Arbe Robotics Ltd.
- 6.4.16 BASELABS GmbH
- 6.4.17 LeddarTech Inc.
- 6.4.18 TDK Corporation
- 6.4.19 Kionix Inc. (ROHM)
- 6.4.20 Memsic Inc.
- 6.4.21 CEVA Inc.
- 6.4.22 AMD Xilinx
7 MARKET OPPORTUNITIES AND FUTURE OUTLOOK
- 7.1 White-Space and Unmet-Need Assessment

