
PUBLISHER: Mordor Intelligence | PRODUCT CODE: 1851035

PUBLISHER: Mordor Intelligence | PRODUCT CODE: 1851035
Self-service BI - Market Share Analysis, Industry Trends & Statistics, Growth Forecasts (2025 - 2030)
The self-service BI market size is estimated at USD 7.10 billion in 2025 and is forecast to reach USD 12.22 billion by 2030, reflecting an 11.47% CAGR.
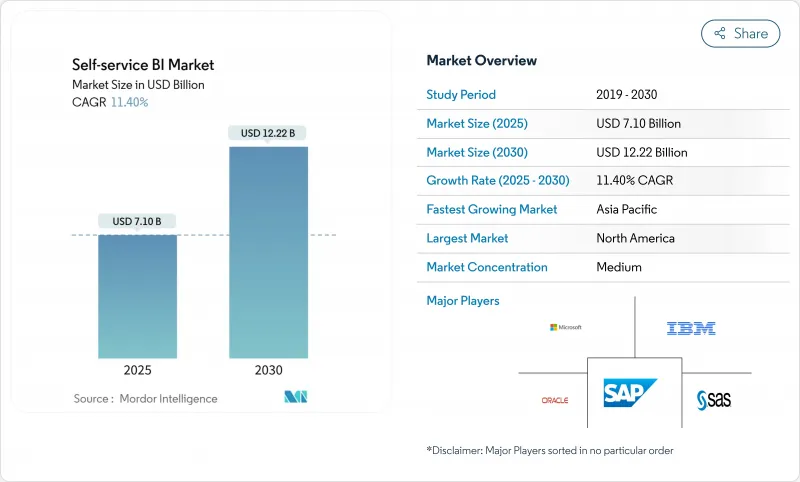
Firms are scaling low-code analytics, embedding generative AI, and shifting workloads to cloud data warehouses, which shortens insight cycles and frees IT staff for strategic work. North American organizations lead adoption after proving that intuitive tools can cut reporting backlogs by roughly one-third, while Asia-Pacific businesses are catching up fast as cloud infrastructure matures. Vendors are racing to integrate natural-language querying that supports multilingual environments, a capability already boosting engagement among European users. Meanwhile, heightened attention to governance, driven by regulatory pressure and shadow-IT incidents, is steering purchasing toward platforms that pair open architectures with automated control features.
Global Self-service BI Market Trends and Insights
Democratization of analytics via low-code/no-code tools
Low-code interfaces let business professionals create dashboards without relying on developers, a shift most visible in North America where 80% of executives credit wider data access for faster decisions. Productivity for analytical tasks has risen 74% as citizen data scientists pair domain knowledge with simplified tooling, unearthing patterns traditional BI teams often overlook. Companies that married democratization with robust semantic layers cut backlog hand-offs and delivered insight within the operational window where actions still matter. This cultural change is expanding platform evaluation criteria from feature depth to the ease of onboarding non-technical staff, driving platform consolidation around intuitive drag-and-drop authoring and in-app guidance.
Surge in cloud-based data warehouses accelerating self-service adoption
Asia-Pacific organizations are leapfrogging legacy stacks by landing data in the cloud, eliminating bottlenecks that once restricted BI concurrency. With the cloud warehouse segment itself climbing at 27.64% CAGR, analytics teams now query fresh data without queuing jobs, shrinking report time by as much as 40%. Firms that align self-service rollouts with warehouse modernization gain triple-speed time-to-insight compared with siloed deployments. Centralized governance baked into these warehouses also raises data quality, enabling consistent metrics across departments.
Shadow-IT risks from uncontrolled visualization tools
Unvetted tool adoption has generated conflicting KPIs and exposed sensitive datasets, costing non-compliant firms USD 1.03 million on average per incident. Marketing and finance units are frequent offenders because rapid iterations tempt them to sidestep IT. Best-in-class enterprises deploy catalog-driven governance, automated lineage, and role-based access that preserve agility yet curb risk, yielding 45% higher adoption than blanket lockdown approaches.
Other drivers and restraints analyzed in the detailed report include:
- Integration of generative AI for natural-language querying
- Embedded analytics demand from SaaS vendors
- Shortage of data-governance talent in emerging economies
For complete list of drivers and restraints, kindly check the Table Of Contents.
Segment Analysis
The software segment continues to anchor revenue, yet services revenue is compounding faster at 15.2% CAGR. Organizations that pair platform purchases with training programs report adoption rates 45% higher than tool-only buyers. Demand is shifting toward continuous enablement subscriptions that cover data-literacy upskilling and governance audits. As a result, implementation specialists are packaging industry-specific playbooks, aligning dashboards with vertical KPIs, and expediting time-to-value. The self-service BI market size for services is projected to reach USD 3.2 billion by 2030, reflecting sustained appetite for human expertise alongside automation.
Software vendors, meanwhile, prioritize AI feature parity, adding NLQ, automated insights, and embedded modes to remain competitive. The relentless update cadence pushes enterprises to favor modular architectures that let them swap analytic engines without ripping out semantic layers. This posture mitigates vendor lock-in concerns and supports mixed-tool environments that evolve as AI capabilities mature.
Cloud deployments own both usage and momentum, commanding 73% of current revenue and adding users at a 13.5% CAGR. Economies of scale let mid-market firms implement enterprise-grade analytics without capital outlay, leveling the playing field with larger peers. Moreover, distributed teams can collaborate on shared workspaces in real time, accelerating feedback loops. Security postures have evolved; encryption-at-rest, private links, and regional data centers now satisfy most regulatory audits, tempering earlier reservations about public cloud.
On-premises solutions persist in heavily regulated verticals where data residency is mandatory. Yet even there, hybrid designs are common: sensitive tables stay onsite while aggregated models sync to the cloud for broad exploration. Over the forecast period, the self-service BI market share for cloud is expected to edge past 80% as hyperscalers integrate BI tightly with their storage and AI services.
Self Service BI Market is Segmented by Component (Software and Services), Deployment Model (Cloud / On-Demand and On-Premises), Application (Sales and Marketing Management, Customer Engagement and Analysis, Fraud and Security Management and More), End-User Industry (BFSI, Healthcare, Manufacturing and More), Organization Size ( Large Enterprises and SMEs), Geography. The Market Forecasts are Provided in Terms of Value (USD).
Geography Analysis
North America retains 42% of self-service BI market revenue, buoyed by early adoption of low-code platforms and the presence of leading vendors. Financial services and healthcare providers there embed natural-language querying in day-to-day workflows, keeping user sentiment high and shadow-IT incidents under control through mature governance programs. R&D investments focus on advanced AI explainability, preparing systems to justify recommendations in regulated settings. Cross-border data-sharing rules remain a watchpoint, yet the region's sophisticated cloud infrastructure continues to attract innovative analytics startups that expand platform ecosystems.
Asia-Pacific is the fastest growing territory, advancing at a 13.77% CAGR. China, India, Japan, and Australia demonstrate vigorous demand as domestic cloud giants and hyperscalers alike pour capital into data centers. SMEs in the region use mobile-first analytics to overcome desktop scarcity, with smartphone dashboards becoming the primary interface for many field employees. Talent shortages in data governance persist, prompting governments and academia to launch certification programs that should ease constraints after 2027. Manufacturing adoption is strong in Japan and South Korea, where predictive maintenance aligns with Industry 4.0 roadmaps, while financial hubs like Singapore emphasize customer analytics to differentiate regional banking services.
Europe shows steady uptake shaped by strict privacy statutes. Organizations balance democratization with GDPR compliance by opting for platforms that support fine-grained consent management and local data processing. Multilingual natural-language interfaces are especially valued, lifting engagement among non-technical staff by 50% in pilot projects. Western European cloud migration is accelerating after regulators clarified that encryption and local failover meet sovereignty requirements. Eastern Europe is catching up quickly as digital transformation funding flows into Poland, Romania, and the Czech Republic. Retail and discrete manufacturing dominate demand, though open-source alternatives gain traction in institutions wary of proprietary lock-in.
South America, the Middle East, and Africa remain early-stage yet promising. Brazil and Mexico head Latin American adoption, with telecom operators and banks seeking real-time customer views. Gulf Cooperation Council governments anchor investment in the Middle East, leveraging BI to support diversification agendas and smart-city initiatives. African uptake is fragmented; South Africa leads enterprise deployments, while Nigeria and Kenya show momentum through fintech ecosystems. Across these regions, cloud solutions enjoy preference owing to limited legacy estates, and mobile dashboards bridge infrastructure gaps in areas where desktop penetration is low.
- Microsoft Corporation
- SAP SE
- Salesforce (Tableau)
- Qlik Tech Intl.
- IBM Corporation
- Oracle Corporation
- SAS Institute
- MicroStrategy Inc.
- TIBCO Software
- Zoho Corporation (Analytics)
- Amazon Web Services (QuickSight)
- Google LLC (Looker)
- Domo Inc.
- Sisense Inc.
- ThoughtSpot Inc.
- Pyramid Analytics
- Yellowfin BI
- GoodData Corp.
- Board International
- Infor (Birst)
- Alibaba Cloud (Quick BI)
- Dundas Data Visualization
- SentryOne (BI Sentry)
- Phocas Software
Additional Benefits:
- The market estimate (ME) sheet in Excel format
- 3 months of analyst support
TABLE OF CONTENTS
1 INTRODUCTION
- 1.1 Study Assumptions and Market Definition
- 1.2 Scope of the Study
2 RESEARCH METHODOLOGY
3 EXECUTIVE SUMMARY
4 MARKET LANDSCAPE
- 4.1 Market Overview
- 4.2 Market Drivers
- 4.2.1 Democratization of Analytics via Low-code/No-code Tools in North America
- 4.2.2 Surge in Cloud-based Data Warehouses Accelerating Self-service Adoption in APAC
- 4.2.3 Integration of Generative AI for Natural-Language Querying in Europe
- 4.2.4 Embedded Analytics Demand from SaaS Vendors in BFSI & Retail
- 4.2.5 Rising Data-Literacy Programs Among Mid-Sized Enterprises
- 4.2.6 Regulatory Push for Data-Residency Compliance Driving Localized BI Platforms (MEA)
- 4.3 Market Restraints
- 4.3.1 Shadow-IT Risks from Uncontrolled Data Visualization Tools
- 4.3.2 Shortage of Data Governance Talent in Emerging Economies
- 4.3.3 High Migration Cost from Legacy BI to Self-service Stacks
- 4.3.4 Vendor Lock-in Concerns with Proprietary Semantic Layers
- 4.4 Value / Supply-Chain Analysis
- 4.5 Technological Outlook
- 4.6 Regulatory Outlook
- 4.7 Porter's Five Forces Analysis
- 4.7.1 Threat of New Entrants
- 4.7.2 Bargaining Power of Buyers
- 4.7.3 Bargaining Power of Suppliers
- 4.7.4 Threat of Substitutes
- 4.7.5 Competitive Rivalry
5 MARKET SIZE AND GROWTH FORECASTS (VALUE)
- 5.1 By Component
- 5.1.1 Software
- 5.1.2 Services
- 5.2 By Deployment Model
- 5.2.1 Cloud / On-Demand
- 5.2.2 On-Premises
- 5.3 By Application
- 5.3.1 Sales and Marketing Management
- 5.3.2 Customer Engagement and Analysis
- 5.3.3 Fraud and Security Management
- 5.3.4 Predictive Asset Maintenance
- 5.3.5 Risk and Compliance Management
- 5.3.6 Supply Chain and Procurement
- 5.3.7 Operations Management
- 5.4 By End-user Industry
- 5.4.1 BFSI
- 5.4.2 Retail and E-commerce
- 5.4.3 Healthcare
- 5.4.4 Manufacturing
- 5.4.5 Telecommunications
- 5.4.6 Media and Entertainment
- 5.4.7 Transportation and Logistics
- 5.4.8 Energy and Utilities
- 5.4.9 Government and Defense
- 5.5 By Organization Size
- 5.5.1 Large Enterprises
- 5.5.2 Small and Medium-sized Enterprises (SMEs)
- 5.6 By Geography
- 5.6.1 North America
- 5.6.1.1 United States
- 5.6.1.2 Canada
- 5.6.1.3 Mexico
- 5.6.2 South America
- 5.6.2.1 Brazil
- 5.6.2.2 Argentina
- 5.6.2.3 Rest of South America
- 5.6.3 Europe
- 5.6.3.1 Germany
- 5.6.3.2 United Kingdom
- 5.6.3.3 France
- 5.6.3.4 Italy
- 5.6.3.5 Spain
- 5.6.3.6 Rest of Europe
- 5.6.4 Asia-Pacific
- 5.6.4.1 China
- 5.6.4.2 Japan
- 5.6.4.3 South Korea
- 5.6.4.4 India
- 5.6.4.5 Rest of Asia-Pacific
- 5.6.5 Middle East and Africa
- 5.6.5.1 United Arab Emirates
- 5.6.5.2 Saudi Arabia
- 5.6.5.3 South Africa
- 5.6.5.4 Rest of Middle East and Africa
- 5.6.1 North America
6 COMPETITIVE LANDSCAPE
- 6.1 Market Concentration
- 6.2 Strategic Moves
- 6.3 Market Share Analysis
- 6.4 Company Profiles (includes Global Overview, Market-level Overview, Core Segments, Financials, Strategic Info, Market Rank/Share, Products & Services, Recent Developments)
- 6.4.1 Microsoft Corporation
- 6.4.2 SAP SE
- 6.4.3 Salesforce (Tableau)
- 6.4.4 Qlik Tech Intl.
- 6.4.5 IBM Corporation
- 6.4.6 Oracle Corporation
- 6.4.7 SAS Institute
- 6.4.8 MicroStrategy Inc.
- 6.4.9 TIBCO Software
- 6.4.10 Zoho Corporation (Analytics)
- 6.4.11 Amazon Web Services (QuickSight)
- 6.4.12 Google LLC (Looker)
- 6.4.13 Domo Inc.
- 6.4.14 Sisense Inc.
- 6.4.15 ThoughtSpot Inc.
- 6.4.16 Pyramid Analytics
- 6.4.17 Yellowfin BI
- 6.4.18 GoodData Corp.
- 6.4.19 Board International
- 6.4.20 Infor (Birst)
- 6.4.21 Alibaba Cloud (Quick BI)
- 6.4.22 Dundas Data Visualization
- 6.4.23 SentryOne (BI Sentry)
- 6.4.24 Phocas Software
7 MARKET OPPORTUNITIES AND FUTURE OUTLOOK
- 7.1 White-space and Unmet-need Assessment

