
PUBLISHER: Mordor Intelligence | PRODUCT CODE: 1851065

PUBLISHER: Mordor Intelligence | PRODUCT CODE: 1851065
Aircraft Auxiliary Power Unit - Market Share Analysis, Industry Trends & Statistics, Growth Forecasts (2025 - 2030)
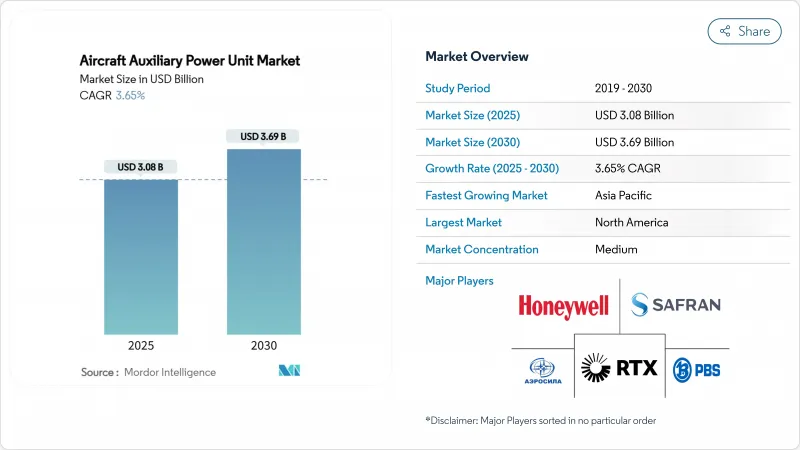
The aircraft auxiliary power unit (APU) market size stands at USD 3.08 billion in 2025 and is forecasted to reach USD 3.69 billion by 2030, advancing at a CAGR of 3.65%.
Moderate expansion stems from airlines shifting toward electrified and hydrogen-ready systems while regulators tighten ground-emissions rules that favor gate-supplied electricity over onboard APUs. Airports enforcing APU-off policies cut ramp emissions up to 50% whenever fixed electrical ground power is available. Commercial airlines command volume through single-aisle deliveries, militaries accelerate technology needs in rotary-wing upgrades, and rising UAV procurement widens demand for micro-rated units. Fuel-cell prototypes gain momentum as Airbus validates hydrogen APUs and Honeywell races to certify 100% sustainable aviation fuel across its conventional line. Meanwhile, supply chain exposure to rare-earth restrictions forces Western OEMs to redesign generators and diversify sourcing.
Global Aircraft Auxiliary Power Unit Market Trends and Insights
Increased Deliveries of Next-Gen Fuel-Efficient Narrowbody Aircraft
China's commercial fleet is expected to double to 9,740 aircraft by 2043, underscoring the sustained demand for APUs optimized for single-aisle operations. Airlines such as Air Arabia selected 131 Honeywell 131-9A units for A320neo aircraft to secure 1-2% fuel savings in High Efficiency Mode. Compact architectures emphasizing rapid starts and minimal thermal loads suit higher-cycle narrowbody schedules. Synergies with LEAP engines enhance dispatch reliability as carriers replace legacy CFM56 fleets. This delivery wave underpins line-fit revenue and a growing spares pipeline for the aircraft auxiliary power unit market.
Rising Retrofit Activity Due to Regulatory APU-Off Mandates
European hubs now enforce electrical ground power use during turnarounds, forcing carriers to upgrade legacy jets with compatible interface kits rather than procure new APUs. Qatar Airways secured the region's first HGT1700 overhaul capacity to cut compliance costs while extending asset life. Assaia's ramp-monitoring analytics enable airports to validate APU-off adherence, converting voluntary eco-measures into compulsory upgrades. As a result, aftermarket margins rise even as original-equipment volumes plateau, offering attractive service income for established suppliers.
Price Instability of Rare-Earth Materials Used in Generator Components
China's export curbs on neodymium and dysprosium inflate magnet costs, creating pricing uncertainty for APU permanent-magnet generators. US Air Force analyses list rare-earth dependence among top aerospace supply vulnerabilities, prompting OEMs to explore recycling and ferrite-based designs that may compromise power density. Contract pricing is now indexed to commodity exposure, affecting long-term maintenance agreements and eroding margins across the aircraft auxiliary power unit market.
Other drivers and restraints analyzed in the detailed report include:
- Expansion of Military UAV Fleets in High-Threat Environments
- Electrification of Ground Operations Driving Adoption of e-APUs
- Preference for Airport Ground Power Units Reducing APU Operating Hours
For complete list of drivers and restraints, kindly check the Table Of Contents.
Segment Analysis
The commercial segment generated 68.21% of 2024 revenue and retains the backbone of the aircraft auxiliary power unit market. Line-fit demand matches Airbus and Boeing production ramps, while airlines pursue APU refurbishments instead of replacements to meet emission rules. Military platforms contribute a smaller base today but accelerate at 4.69% CAGR through 2030 as programs such as US rotary-wing modernization specify higher-output electric systems. This defense tailwind supports technology spillovers into civil variants, sustaining value creation across the aircraft auxiliary power unit industry.
Sustained narrowbody deliveries in Asia and North America anchor volume, whereas widebody jets require higher-rated APUs to power galleys and environmental control packs. On the military side, UAVs and transport aircraft adopt micro-and macro-rated solutions, broadening the application matrix. Business jets form a premium niche valuing rapid spool-up and cabin comfort, generating above-average aftermarket yields.
Fixed-wing deliveries kept an 80.65% hold on 2024 shipments, reflecting single-aisle production cycles and freighter conversions. Rotary-wing upgrades add 3.87% CAGR, propelled by programs that embed digital avionics and electronic warfare packages requiring a cleaner electrical supply. Helicopter APUs must fit constrained bays and tolerate vibration, driving miniaturized heat exchangers and variable-speed architectures.
Emerging eVTOL prototypes rely on auxiliary generation for backup power and system redundancy, injecting new design criteria. Fixed-wing fuel-cell trials on Airbus A330 demonstrate how long-range platforms may pivot toward alternative energy once certification hurdles are cleared, setting future demand patterns for the aircraft auxiliary power unit market.
The Aircraft Auxiliary Power Unit (APU) Market Report is Segmented by Platform (Commercial, Military, and General Aviation), Aircraft Type (Fixed-Wing and Rotary-Wing), Power Rating (Less Than 50 KVA, 50 To 150 KVA, and More Than 150 KVA), Technology (Conventional Turboshaft, Battery-Electric, and Fuel-Cell), and Geography (North America, Europe, Asia-Pacific, and More). The Market Forecasts are Provided in Terms of Value (USD).
Geography Analysis
North America retained a 32.78% share in 2024, anchored by Boeing deliveries and sustained Pentagon spending that underwrite R&D for next-generation solutions. Government stimulus for domestic critical minerals processing also intends to reduce rare-earth exposure. The aircraft auxiliary power unit market size is forecasted to grow steadily as GTF and LEAP fleets mature and enter heavy maintenance cycles.
Asia-Pacific is the fastest riser at 5.40% CAGR through 2030, driven by China's C919 rollout and India's forecast for 19,500 new aircraft by 2043. Joint ventures such as Safran-HAL localize parts production, trimming lead times, and aligning with regional offset mandates. Aftermarket revenues will multiply as the regional fleet reaches 129 USD billion service value by 2043, deepening the aircraft auxiliary power unit market footprint.
Europe leverages policy leadership to push low-emission power units under the Clean Aviation umbrella. Hydrogen infrastructure pilots and stringent APU-off enforcement foster innovation in low-NOx combustion and fuel cells. While ground power prevalence tempers unit sales, it pressures suppliers to deliver ultra-efficient products that satisfy airlines facing tight turnaround and environmental compliance.
- Honeywell International Inc.
- RTX Corporation
- Safran SA
- JSC SPE Aerosila
- Technodinamika (Rostec)
- PBS Group a.s.
- Rolls-Royce plc
- Motor Sich JSC
- Aegis Power Systems, Inc.
- Eaton Corporation plc
- Liebherr Aerospace (Liebherr Group)
- Jakadofsky GmbH
Additional Benefits:
- The market estimate (ME) sheet in Excel format
- 3 months of analyst support
TABLE OF CONTENTS
1 INTRODUCTION
- 1.1 Study Assumptions and Market Definition
- 1.2 Scope of the Study
2 RESEARCH METHODOLOGY
3 EXECUTIVE SUMMARY
4 MARKET LANDSCAPE
- 4.1 Market Overview
- 4.2 Market Drivers
- 4.2.1 Increased deliveries of next-gen fuel-efficient narrowbody aircraft
- 4.2.2 Rising retrofit activity due to regulatory mandates on APU-off operations
- 4.2.3 Expansion of military UAV fleets in high-threat environments
- 4.2.4 Electrification of ground operations driving adoption of e-APUs
- 4.2.5 Emergence of commercial spaceplanes creating demand for micro-APUs
- 4.2.6 Integration of APUs into hybrid-electric propulsion architectures
- 4.3 Market Restraints
- 4.3.1 Price instability of rare-earth materials used in generator components
- 4.3.2 Preference for airport ground power units reducing APU operating hours
- 4.3.3 Lengthy and rigid certification processes for new-energy APU technologies
- 4.3.4 Thermal management challenges in compact aircraft APU designs
- 4.4 Value Chain Analysis
- 4.5 Regulatory Landscape
- 4.6 Technological Outlook
- 4.7 Porter's Five Forces Analysis
- 4.7.1 Threat of New Entrants
- 4.7.2 Bargaining Power of Buyers
- 4.7.3 Bargaining Power of Suppliers
- 4.7.4 Threat of Substitutes
- 4.7.5 Intensity of Competitive Rivalry
5 MARKET SIZE AND GROWTH FORECASTS (VALUE)
- 5.1 By Platform
- 5.1.1 Commercial
- 5.1.1.1 Narrowbody Aircraft
- 5.1.1.2 Widebody Aircraft
- 5.1.1.3 Regional Jets
- 5.1.2 Military
- 5.1.2.1 Combat
- 5.1.2.2 Special Mission
- 5.1.2.3 Transport
- 5.1.2.4 Trainer
- 5.1.2.5 Unmanned Aerial Vehicles (UAVs)
- 5.1.3 General Aviation
- 5.1.3.1 Light Aircraft
- 5.1.3.2 Business Jets
- 5.1.3.3 Helicopters
- 5.1.1 Commercial
- 5.2 By Aircraft Type
- 5.2.1 Fixed-Wing
- 5.2.2 Rotary-Wing
- 5.3 By Power Rating
- 5.3.1 less than 50 kVA
- 5.3.2 50 to 150 kVA
- 5.3.3 more than 150 kVA
- 5.4 By Technology
- 5.4.1 Conventional Turboshaft
- 5.4.2 Battery-Electric
- 5.4.3 Fuel-Cell
- 5.5 By Geography
- 5.5.1 North America
- 5.5.1.1 United States
- 5.5.1.2 Canada
- 5.5.1.3 Mexico
- 5.5.2 Europe
- 5.5.2.1 United Kingdom
- 5.5.2.2 Germany
- 5.5.2.3 France
- 5.5.2.4 Italy
- 5.5.2.5 Rest of Europe
- 5.5.3 Asia-Pacific
- 5.5.3.1 China
- 5.5.3.2 India
- 5.5.3.3 Japan
- 5.5.3.4 South Korea
- 5.5.3.5 Rest of Asia-Pacific
- 5.5.4 South America
- 5.5.4.1 Brazil
- 5.5.4.2 Rest of South America
- 5.5.5 Middle East and Africa
- 5.5.5.1 Middle East
- 5.5.5.1.1 United Arab Emirates
- 5.5.5.1.2 Saudi Arabia
- 5.5.5.1.3 Qatar
- 5.5.5.1.4 Rest of Middle East
- 5.5.5.2 Africa
- 5.5.5.2.1 South Africa
- 5.5.5.2.2 Egypt
- 5.5.5.2.3 Rest of Africa
- 5.5.1 North America
6 COMPETITIVE LANDSCAPE
- 6.1 Market Concentration
- 6.2 Strategic Moves
- 6.3 Market Share Analysis
- 6.4 Company Profiles (includes Global level Overview, Market level overview, Core Segments, Financials as available, Strategic Information, Market Rank/Share for key companies, Products and Services, and Recent Developments)
- 6.4.1 Honeywell International Inc.
- 6.4.2 RTX Corporation
- 6.4.3 Safran SA
- 6.4.4 JSC SPE Aerosila
- 6.4.5 Technodinamika (Rostec)
- 6.4.6 PBS Group a.s.
- 6.4.7 Rolls-Royce plc
- 6.4.8 Motor Sich JSC
- 6.4.9 Aegis Power Systems, Inc.
- 6.4.10 Eaton Corporation plc
- 6.4.11 Liebherr Aerospace (Liebherr Group)
- 6.4.12 Jakadofsky GmbH
7 MARKET OPPORTUNITIES AND FUTURE OUTLOOK
- 7.1 White-space and Unmet-Need Assessment

