
PUBLISHER: Mordor Intelligence | PRODUCT CODE: 1851069

PUBLISHER: Mordor Intelligence | PRODUCT CODE: 1851069
Algorithmic Trading - Market Share Analysis, Industry Trends & Statistics, Growth Forecasts (2025 - 2030)
The algorithmic trading market size is estimated at USD 18.73 billion in 2025 and is forecast to reach USD 28.44 billion by 2030, expanding at an 8.71% CAGR.
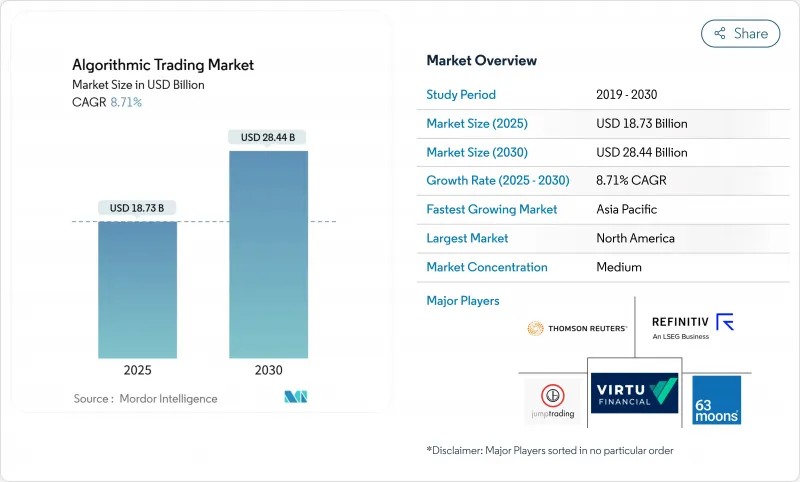
Uptake is accelerating as artificial-intelligence techniques boost execution quality and allow traders to cope with volatile conditions. Exchanges in North America lead innovation, while robust demand from Asia-Pacific widens the addressable user base. Institutional desks still anchor volumes, yet retail access to low-code automation is reshaping competitive dynamics. Services linked to model design and compliance are outpacing platform revenues, counterbalancing heavier spending on secure on-premise infrastructure. At the same time, cloud latency is falling fast enough to tempt smaller firms that once sat on the sidelines.
Global Algorithmic Trading Market Trends and Insights
Rising demand for sub-millisecond order execution
Latency competition has moved from microseconds to picoseconds in US and Japanese equities. Firms deploy field-programmable gate arrays and bespoke fibre routes to shave time, aiming to capture part of the USD 5 billion global value tied to latency arbitrage each year . Litigation over patent rights underscores the strategic value of speed. Capital-intensive upgrades, however, tilt the advantages toward well-funded players and may heighten market concentration.
Surging passive-investment AUM fuelling index-rebalance algos
Global ETF assets touched USD 13.8 trillion in 2024 . Rebalancing flows trigger large, time-compressed orders that demand sophisticated algorithmic execution able to track benchmark weights without moving prices. Europe's share of passive UCITS funds more than doubled over the past decade, intensifying the need for cross-asset models that minimise market impact while coping with complex correlations.
Rising exchange colocation costs squeezing mid-tier desks
Fee hikes such as the increase to USD 13,500 per month for 10 Gb ULL fibre at MIAX PEARL weigh on balance sheets and may force mid-sized proprietary shops to scale back. High entry costs protect incumbents but thin the competitive field, potentially reducing spread tightness in less-traded instruments.
Other drivers and restraints analyzed in the detailed report include:
- Expansion of crypto-exchange API liquidity pools
- Regulatory push for best-execution
- Instant loss of liquidity during flash-crash events
For complete list of drivers and restraints, kindly check the Table Of Contents.
Segment Analysis
Institutional investors commanded 61% of the algorithmic trading market in 2024, anchored by deep capital and infrastructure. Retail traders, however, are growing fastest at a 10.8% CAGR as easy-to-use platforms replicate institutional toolkits. Brokerage portals now bundle strategy builders, order-routing algos, and back-testing libraries, lowering technical barriers. Educational initiatives reinforce adoption by boosting trust and demystifying automation. Regulatory bodies remain vigilant to ensure adequate safeguards for non-professional users.
Retail participation injects fresh order flow and fosters competitive quoting. Yet heavier retail turnover also magnifies the need for robust risk controls because crowd-sourced models can unintentionally converge. Brokerage analytics show rising preference for short-cycle strategies that exploit intraday micro-structure, often mirroring institutional scalping tactics. Over time, the influx of retail volumes can dilute traditional desk advantages in certain liquidity pockets.
Solutions captured 73.5% of the algorithmic trading market share in 2024, bundling execution engines, analytics dashboards, and connectivity adapters. Still, the services segment is on an 11.6% CAGR trajectory, reflecting appetite for bespoke model tuning, regulatory reporting, and custom data integration. Clients increasingly outsource niche tasks such as reinforcement-learning policy calibration or post-trade venue analysis to specialist consultants, who combine financial engineering with domain-specific AI skills.
The rise in services is reinforced by rapid rule changes that require continual recoding. Firms lacking in-house quant bandwidth lean on advisory teams to maintain code bases, validate model risk, and conduct explainability audits. Coupled with the shift to cloud-native pipelines, service firms that master both DevOps and trading logic find a widening revenue pool.
Algorithmic Trading Market is Segmented by Types of Traders (Institutional Investors, Retail Investors, Long-Term Traders, Short-Term Traders), Component (Solutions, Services), Deployment (Cloud, On-Premise), Organisation Size (Small and Medium Enterprises, Large Enterprises), Geography. The Market Forecasts are Provided in Terms of Value (USD).
Geography Analysis
North America contributed 47.3% of global turnover in 2024. Regulatory clarity, a dense exchange network, and close integration between asset managers and technology vendors sustain growth. The SEC's update to Regulation NMS raises transparency standards, reinforcing algorithmic execution as a compliance necessity. AI-based sentiment analytics already influence large-cap order books, while research into machine-learning midpoint indicators fosters novel liquidity-seeking strategies.
Asia-Pacific delivers the strongest momentum, projected at a 12.4% CAGR through 2030. Japan's mature equity venue infrastructure supports picosecond experimentation, whereas China balances expansion with higher HFT fees aimed at curbing excess churn. South-East Asian crypto venues export standardised APIs, blending digital-asset liquidity with equities and FX workflows. India's regulator is drafting guidelines to open algorithmic trading to a broader retail base while preserving systemic safeguards.
Europe occupies a pivotal position shaped by MiFID II. Stringent transparency and circuit-breaker obligations heighten demand for auditable code. Passive-investment flows dominate turnover, pushing providers to refine index-rebalance algos that mitigate tracking error. The European Central Bank's stability review warns that high valuations could amplify risks when automated flows unwind, underscoring the need for scenario testing . Multi-dealer FX portals in the Middle East and Africa begin to close historical liquidity gaps, inviting systematic funds to deploy cross-currency spreads previously deemed infeasible.
- Thomson Reuters Corp.
- Refinitiv Ltd
- Virtu Financial Inc.
- Jump Trading LLC
- Citadel Securities LLC
- Hudson River Trading LLC
- Tower Research Capital LLC
- XTX Markets Ltd
- Goldman Sachs Group Inc.
- JPMorgan Chase and Co.
- IG Group Holdings plc
- 63 Moons Technologies Ltd
- MetaQuotes Software Corp.
- Symphony Fintech Solutions Pvt Ltd
- InfoReach Inc.
- AlgoTrader AG
- ARGO SE
- Kuberre Systems Inc.
- KCG Holdings LLC
- DRW Holdings LLC
Additional Benefits:
- The market estimate (ME) sheet in Excel format
- 3 months of analyst support
TABLE OF CONTENTS
1 INTRODUCTION
- 1.1 Study Assumptions and Market Definition
- 1.2 Scope of the Study
2 RESEARCH METHODOLOGY
3 EXECUTIVE SUMMARY
4 MARKET LANDSCAPE
- 4.1 Market Overview
- 4.2 Market Drivers
- 4.2.1 Rising demand for sub-millisecond order execution across US and Japanese equity venues
- 4.2.2 Surging passive-investment AUM fuelling index-rebalance algos in Europe
- 4.2.3 Expansion of crypto-exchange API liquidity pools in South-East Asia
- 4.2.4 Consolidation of fragmented FX liquidity via multi-dealer platforms in ME and Africa
- 4.2.5 Proliferation of AI-driven sentiment feeds (alt-data) in US large-cap trading
- 4.2.6 Regulatory push for best-execution (MiFID II, SEC Reg NMS modernisation)
- 4.3 Market Restraints
- 4.3.1 Rising exchange colocation costs squeezing mid-tier prop desks
- 4.3.2 Instant loss of liquidity during "flash-crash" events
- 4.3.3 Stringent market-surveillance fines on HFT spoofing in EU
- 4.3.4 Data-feed latency differentials in emerging exchanges
- 4.4 Regulatory Outlook
- 4.5 Porter's Five Forces Analysis
- 4.5.1 Bargaining Power of Suppliers
- 4.5.2 Bargaining Power of Buyers / Investors
- 4.5.3 Threat of New Entrants
- 4.5.4 Threat of Substitutes
- 4.5.5 Intensity of Competitive Rivalry
- 4.6 Technology Snapshot
- 4.6.1 Algorithmic Trading Strategies
- 4.6.1.1 Momentum Trading
- 4.6.1.2 Arbitrage Trading
- 4.6.1.3 Trend Following
- 4.6.1.4 Execution-based Strategies
- 4.6.1.5 Sentiment Analysis
- 4.6.1.6 Index-fund Rebalancing
- 4.6.1.7 Mathematical-model-based
- 4.6.1.8 Other Strategies
- 4.6.1 Algorithmic Trading Strategies
- 4.7 Impact of Macroeconomic Factors on the Market
5 MARKET SIZE AND GROWTH FORECASTS (VALUE)
- 5.1 By Types of Traders
- 5.1.1 Institutional Investors
- 5.1.2 Retail Investors
- 5.1.3 Long-term Traders
- 5.1.4 Short-term Traders
- 5.2 By Component
- 5.2.1 Solutions
- 5.2.1.1 Platforms
- 5.2.1.2 Software Tools
- 5.2.2 Services
- 5.2.1 Solutions
- 5.3 By Deployment
- 5.3.1 Cloud
- 5.3.2 On-premise
- 5.4 By Organisation Size
- 5.4.1 Small and Medium Enterprises
- 5.4.2 Large Enterprises
- 5.5 By Geography
- 5.5.1 North America
- 5.5.1.1 United States
- 5.5.1.2 Canada
- 5.5.1.3 Mexico
- 5.5.2 South America
- 5.5.2.1 Brazil
- 5.5.2.2 Argentina
- 5.5.2.3 Chile
- 5.5.2.4 Peru
- 5.5.2.5 Rest of South America
- 5.5.3 Europe
- 5.5.3.1 Germany
- 5.5.3.2 United Kingdom
- 5.5.3.3 France
- 5.5.3.4 Italy
- 5.5.3.5 Spain
- 5.5.3.6 Rest of Europe
- 5.5.4 Asia-Pacific
- 5.5.4.1 China
- 5.5.4.2 Japan
- 5.5.4.3 South Korea
- 5.5.4.4 India
- 5.5.4.5 Australia
- 5.5.4.6 New Zealand
- 5.5.4.7 Rest of Asia-Pacific
- 5.5.5 Middle East and Africa
- 5.5.5.1 United Arab Emirates
- 5.5.5.2 Saudi Arabia
- 5.5.5.3 Turkey
- 5.5.5.4 South Africa
- 5.5.5.5 Rest of Middle East and Africa
- 5.5.1 North America
6 COMPETITIVE LANDSCAPE
- 6.1 Strategic Developments
- 6.2 Vendor Positioning Analysis
- 6.3 Company Profiles (includes Global level Overview, Market level overview, Core Segments, Financials as available, Strategic Information, Products and Services, and Recent Developments)
- 6.3.1 Thomson Reuters Corp.
- 6.3.2 Refinitiv Ltd
- 6.3.3 Virtu Financial Inc.
- 6.3.4 Jump Trading LLC
- 6.3.5 Citadel Securities LLC
- 6.3.6 Hudson River Trading LLC
- 6.3.7 Tower Research Capital LLC
- 6.3.8 XTX Markets Ltd
- 6.3.9 Goldman Sachs Group Inc.
- 6.3.10 JPMorgan Chase and Co.
- 6.3.11 IG Group Holdings plc
- 6.3.12 63 Moons Technologies Ltd
- 6.3.13 MetaQuotes Software Corp.
- 6.3.14 Symphony Fintech Solutions Pvt Ltd
- 6.3.15 InfoReach Inc.
- 6.3.16 AlgoTrader AG
- 6.3.17 ARGO SE
- 6.3.18 Kuberre Systems Inc.
- 6.3.19 KCG Holdings LLC
- 6.3.20 DRW Holdings LLC
7 MARKET OPPORTUNITIES AND FUTURE OUTLOOK
- 7.1 White-space and Unmet-need Assessment

