
PUBLISHER: Mordor Intelligence | PRODUCT CODE: 1851073

PUBLISHER: Mordor Intelligence | PRODUCT CODE: 1851073
Freight Forwarding - Market Share Analysis, Industry Trends & Statistics, Growth Forecasts (2025 - 2030)
The freight forwarding market is valued at USD 572.25 billion in 2025 and is forecast to reach USD 740.85 billion by 2030, expanding at a 5.3% CAGR.
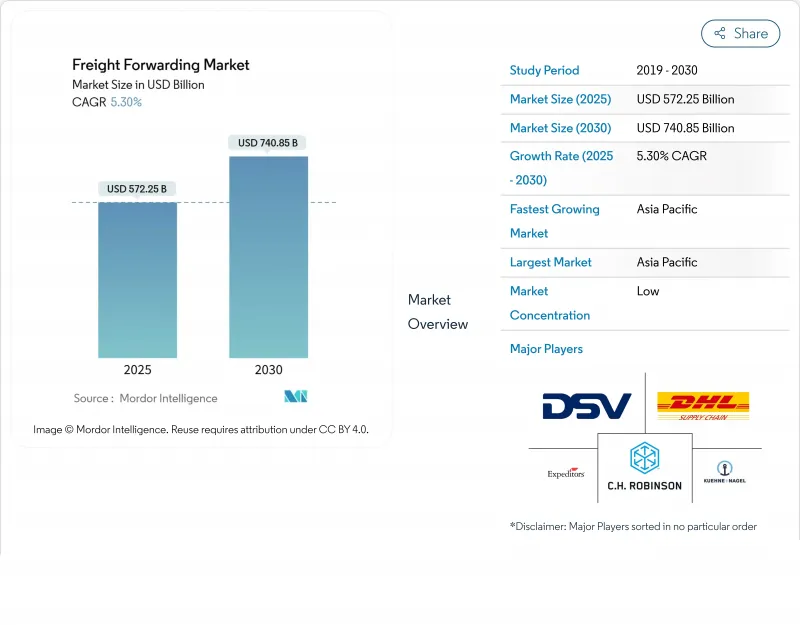
The upward trajectory continues despite geopolitical tensions and repeated supply-chain shocks because digital platforms, resilient multimodal networks, and sustained e-commerce flows keep volumes intact. Heightened demand for parcel-sized cross-border shipments, steady investment in temperature-controlled capacity, and a structural pivot toward near-shoring all lift volumes in every major trade lane. Second-order effects include faster technology adoption, new premium service tiers built around real-time visibility, and an observed tilt toward consolidation as forwarders strive for scale advantages. M&A activity, spearheaded by DSV's USD 15.9 billion takeover of DB Schenker in 2025, illustrates how scale and data density now underpin competitive positioning in the freight forwarding market.
Global Freight Forwarding Market Trends and Insights
Surging Cross-Border E-commerce Parcel Volumes
Record online spending in Asia continues to drive small-parcel flows toward North American consumers. Freight forwarders are repurposing existing facilities into parcel sortation hubs, integrating customs pre-clearance, and layering predictive duty-tax calculators to remove purchase friction. Service speed rather than simple cost now determines routing decisions, encouraging carriers to expand weekly sailings on trans-Pacific express lanes. Value-added features, such as isotopic parcel-level visibility and branded returns, help incumbents defend share against pure-play parcel integrators.
Near-shoring-Led Manufacturing Shifts
Proximity manufacturing in Mexico, Poland, and Turkiye pulls freight volumes from long-haul ocean to shorter multimodal corridors. Cross-border truckload demand on the US-Mexico lane grew double digits in 2024, stimulating investments in streamlined border-clearance software and bonded inland ports. Forwarders with customs brokerage depth monetize complex tariff regimes, while integrated rail-truck solutions shorten door-to-door time by 35% compared with ocean alternatives.
Port Congestion & Container Imbalances
Extended berth queues, equipment shortages, and unpredictable sailing schedules inflate transit variability. Average dwell time at major Asian ports more than doubled versus 2023, and equipment repositioning now adds an 18-day buffer on several head-haul trades. Forwarders pre-book container slots weeks ahead, negotiate priority gate windows, and charter supplemental feeders to bypass gridlocked hubs. Spot rates on Asia-Europe lanes spiked 255% in early 2025, forcing shippers to rebalance sourcing or absorb cost surges.
Other drivers and restraints analyzed in the detailed report include:
- Direct-to-Consumer Brand Proliferation
- Reefer Capacity Expansion for Pharma
- Global Driver Shortage
For complete list of drivers and restraints, kindly check the Table Of Contents.
Segment Analysis
Ocean freight retained a 62% freight forwarding market share in 2024 because it offers the lowest cost per TEU for high-volume goods moving across oceans. The segment benefits from megavessel deployments, automated terminals, and expanded mainline-feeder networks that keep slot costs low. Despite its scale, ocean services face chokepoints, motivating shippers to add rail or air legs when schedule integrity falters. Multimodal solutions therefore log a 6.4% CAGR, as forwarders bundle ocean, rail, and road to shave lead times by two to four days on Asia-Europe lanes. Rail volumes on the Eurasian corridor climbed 10.7% in 2024 and continue to diversify routing risk. Air forwarding still dominates time-critical pharma, electronics, and fashion drops, with capacity rebounding as belly-hold networks rebuild. Road forwarding secures regional distribution and last-mile fulfilment but remains cost-sensitive because fuel surcharges and driver scarcity inflate line-haul rates. Forwarders that orchestrate mode-agnostic routing enjoy higher wallet share and deeper client lock-in across every freight forwarding market region.
The freight forwarding market size for multimodal services is forecast to expand at a CAGR of 6.4% by 2030. Integrated control-tower platforms, unified quoting engines, and block-train charters enhance operational agility and margin retention. Pure ocean or air specialists now partner with intermodal rail operators to keep customers from switching providers. Technology that digitises customs hand-offs, auto-allocates container equipment, and releases arrival notifications in a single dashboard plays a central role. Market leaders report that end-to-end multimodal contracts lift client retention by 22%, highlighting the stickiness of an orchestrated service bundle in the freight forwarding market.
Large enterprises captured 70% of the freight forwarding market size in 2024, leveraging yearly tender volumes above 50,000 TEUs to lock in index-linked ocean and air contracts. Their procurement departments demand unified global KPIs and carbon accounting, driving forwarders to build analytics layers atop operational data. Smaller exporters historically lacked negotiating power, but digital marketplaces now aggregate SME demand and auction it to carriers in daily spot buys, cutting freight spends by 12%. This dynamic pushes the SME slice of the freight forwarding market to a 6.6% CAGR. Freight platforms offer instant quotes, milestone alerts, and integrated trade-finance modules that align with SME cash-flow cycles.
SME participation also sharpens compliance needs because novice shippers may misdeclare cargo, inviting fines. Digital documentation wizards flag restricted commodities and pre-populate standard forms, reducing customs holds by 19%. Forwarders diversify revenue by bundling insurance, duty-drawback filing, and e-invoicing into subscription tiers. Large industrial clients still dominate heavyweight project cargo and plant relocation work, but the incremental growth momentum lies with SMEs shipping e-commerce replenishment and niche finished goods. The freight forwarding market will therefore exhibit a progressively balanced customer portfolio as demand from resource-constrained exporters accelerates.
The Freight Forwarding Market Report is Segmented by Mode of Transport (Air Freight Forwarding, Ocean Freight Forwarding, and More), by Enterprise Size (Small & Medium Enterprises, and More), by Forwarder Model (Traditional Asset-Light Forwarders, and More), by End-User Industry (Industrial and Manufacturing, and More) and Geography (North America, Europe, and More). The Market Forecasts are Provided in Terms of Value (USD).
Geography Analysis
Asia-Pacific led the freight forwarding market with a 36% revenue share in 2024 while expanding at a 7.8% CAGR through 2030. Manufacturing diversification into Vietnam, Indonesia, and India spikes regional volumes as brands hedge sourcing risk. Major ports in Shanghai, Shenzhen, and Singapore invest heavily in automated cranes and smart-gate technology that shortens truck turnaround times, yet berth utilizations still hover near record highs. DP World expects Asia-Pacific ports collectively to handle 200,000 TEUs annually by 2027, affirming the region's anchoring role in global supply chains.
North America ranks second in the freight forwarding market, bolstered by the United States' strong consumer demand and ongoing near-shoring that boosts US-Mexico cross-border traffic by 10% in 2024. Railroad investments in double-stack corridors across Texas and Arizona accelerate modal shift from long-haul truck to intermodal, easing driver-capacity bottlenecks. Canadian gateways in Vancouver and Prince Rupert expand rail-mount capacity to redirect Asia cargo away from crowded US West Coast terminals.
Europe's network faces compounded challenges from driver shortages, stringent emissions mandates, and patchwork border regulations. However, sustained demand for value-added services, especially in pharma and high-tech machinery, preserves revenue. Leading hubs in Rotterdam, Hamburg, and Antwerp digitize customs and deploy shore-power solutions to comply with the Fit-for-55 goals. Beyond the tri-continent core, South America grows rapidly on the back of the Capricorn BI oceanic Corridor, which promises to cut intra-Mercosur transit costs by up to 40% once completed in 2027. The Middle East expands Jebel Ali and King Abdullah Port to position itself as a bridging node between East-West trade, while African corridors benefit from Chinese-financed rail revamps that unlock inland commodity flows.
- Kuehne + Nagel International AG
- DHL Global Forwarding
- DSV A/S (DSV Panorama)
- C.H. Robinson Worldwide Inc.
- Expeditors International of Washington Inc.
- Bollore Logistics
- Nippon Express Co. Ltd.
- CEVA Logistics (SCX)
- GEODIS SA
- Hellmann Worldwide Logistics SE
- Dachser SE
- Kerry Logistics Network Ltd.
- Yusen Logistics Co. Ltd.
- Agility Logistics
- Maersk Logistics and Services (incl. Damco)
- FedEx Logistics
- UPS Supply Chain Solutions
- Sinotrans Ltd.
- XPO Logistics
- Uber Freight LLC
- Lineage Logistics
- Kintetsu World Express
- LX Pantos
- CIMC Wetrans Logistics
- Toll Group
Additional Benefits:
- The market estimate (ME) sheet in Excel format
- 3 months of analyst support
TABLE OF CONTENTS
1 Introduction
- 1.1 Study Assumptions and Market Definition
- 1.2 Scope of the Study
2 Research Methodology
3 Executive Summary
4 Market Landscape
- 4.1 Market Overview
- 4.2 Market Drivers
- 4.2.1 Surging Cross-Border E-commerce Parcel Volumes Across Asia-Origin to North America
- 4.2.2 Near-shoring-Led Manufacturing Shifts Driving Mexico-US Road Freight Demand
- 4.2.3 Direct-to-Consumer (D2C) brand proliferation demanding international small-parcel fulfilment
- 4.2.4 Reefer Capacity Expansion Supporting Temperature-Controlled Pharma Shipments
- 4.2.5 On-demand grocery and meal-kit services fuelling cold-chain and same-day freight volumes
- 4.2.6 Consumer expectation for real-time visibility pushing retailers toward tech-heavy forwarders
- 4.3 Market Restraints
- 4.3.1 Port Congestion and Container Imbalances Escalating Transit Uncertainty
- 4.3.2 Global Driver Shortage Inflating Road Freight Rates in North America and Europe
- 4.3.3 Accelerated fashion return cycles adding cost drag and margin pressure on forwarders
- 4.4 Value / Supply-Chain Analysis
- 4.5 Industry Policies and Regulations
- 4.6 Technological Developments in the Market
- 4.7 Porter's Five Forces
- 4.7.1 Threat of New Entrants
- 4.7.2 Bargaining Power of Buyers
- 4.7.3 Bargaining Power of Suppliers
- 4.7.4 Threat of Substitutes
- 4.7.5 Intensity of Competitive Rivalry
- 4.8 Impact of Geopolitical Events on the Market
5 Market Size and Growth Forecasts (Value)
- 5.1 By Mode of Transport
- 5.1.1 Ocean Freight Forwarding
- 5.1.1.1 Full Container Load (FCL)
- 5.1.1.2 Less-Than-Container Load (LCL)
- 5.1.2 Road Freight Forwarding
- 5.1.2.1 Full Truck Load (FTL)
- 5.1.2.2 Less-Than-Truck Load (LTL)
- 5.1.3 Air Freight Forwarding
- 5.1.4 Rail Freight Forwarding
- 5.1.5 Multimodal and Intermodal Forwarding
- 5.1.1 Ocean Freight Forwarding
- 5.2 By Enterprise Size
- 5.2.1 Small and Medium Enterprises
- 5.2.2 Large Enterprises
- 5.3 By Forwarder Model
- 5.3.1 Traditional Asset-Light Forwarders
- 5.3.2 Digital-First / Online Freight Platforms
- 5.3.3 Others
- 5.4 By End-user Industry
- 5.4.1 Industrial and Manufacturing
- 5.4.2 Retail and E-commerce
- 5.4.3 Healthcare and Pharmaceuticals
- 5.4.4 Oil, Gas and Energy
- 5.4.5 Food and Beverages
- 5.4.6 Automotive
- 5.4.7 Chemicals
- 5.4.8 Other End-users
- 5.5 By Geography
- 5.5.1 North America
- 5.5.1.1 United States
- 5.5.1.2 Canada
- 5.5.1.3 Mexico
- 5.5.2 South America
- 5.5.2.1 Brazil
- 5.5.2.2 Argentina
- 5.5.2.3 Chile
- 5.5.2.4 Rest of South America
- 5.5.3 Europe
- 5.5.3.1 Germany
- 5.5.3.2 United Kingdom
- 5.5.3.3 France
- 5.5.3.4 Spain
- 5.5.3.5 Italy
- 5.5.3.6 Netherlands
- 5.5.3.7 Russia
- 5.5.3.8 Rest of Europe
- 5.5.4 Asia-Pacific
- 5.5.4.1 China
- 5.5.4.2 India
- 5.5.4.3 Japan
- 5.5.4.4 South Korea
- 5.5.4.5 Singapore
- 5.5.4.6 Vietnam
- 5.5.4.7 Indonesia
- 5.5.4.8 Australia
- 5.5.4.9 Rest of Asia-Pacific
- 5.5.5 Middle East
- 5.5.5.1 United Arab Emirates
- 5.5.5.2 Saudi Arabia
- 5.5.5.3 Turkey
- 5.5.5.4 Israel
- 5.5.5.5 Rest of Middle East
- 5.5.6 Africa
- 5.5.6.1 South Africa
- 5.5.6.2 Egypt
- 5.5.6.3 Nigeria
- 5.5.6.4 Kenya
- 5.5.6.5 Rest of Africa
- 5.5.1 North America
6 Competitive Landscape
- 6.1 Market Concentration
- 6.2 Strategic Moves
- 6.3 Market Share Analysis
- 6.4 Company Profiles (includes Global level Overview, Market level overview, Core Segments, Financials as available, Strategic Information, Market Rank/Share, Products and Services, Recent Developments)
- 6.4.1 Kuehne + Nagel International AG
- 6.4.2 DHL Global Forwarding
- 6.4.3 DSV A/S (DSV Panorama)
- 6.4.4 C.H. Robinson Worldwide Inc.
- 6.4.5 Expeditors International of Washington Inc.
- 6.4.6 Bollore Logistics
- 6.4.7 Nippon Express Co. Ltd.
- 6.4.8 CEVA Logistics (SCX)
- 6.4.9 GEODIS SA
- 6.4.10 Hellmann Worldwide Logistics SE
- 6.4.11 Dachser SE
- 6.4.12 Kerry Logistics Network Ltd.
- 6.4.13 Yusen Logistics Co. Ltd.
- 6.4.14 Agility Logistics
- 6.4.15 Maersk Logistics and Services (incl. Damco)
- 6.4.16 FedEx Logistics
- 6.4.17 UPS Supply Chain Solutions
- 6.4.18 Sinotrans Ltd.
- 6.4.19 XPO Logistics
- 6.4.20 Uber Freight LLC
- 6.4.21 Lineage Logistics
- 6.4.22 Kintetsu World Express
- 6.4.23 LX Pantos
- 6.4.24 CIMC Wetrans Logistics
- 6.4.25 Toll Group
7 Market Opportunities and Future Outlook

