
PUBLISHER: Mordor Intelligence | PRODUCT CODE: 1851107

PUBLISHER: Mordor Intelligence | PRODUCT CODE: 1851107
5G Connection - Market Share Analysis, Industry Trends & Statistics, Growth Forecasts (2025 - 2030)
The 5G connections market currently generates USD 199.49 billion in revenue and is forecast to reach USD 667.88 billion by 2030, advancing at a 27.34% CAGR.
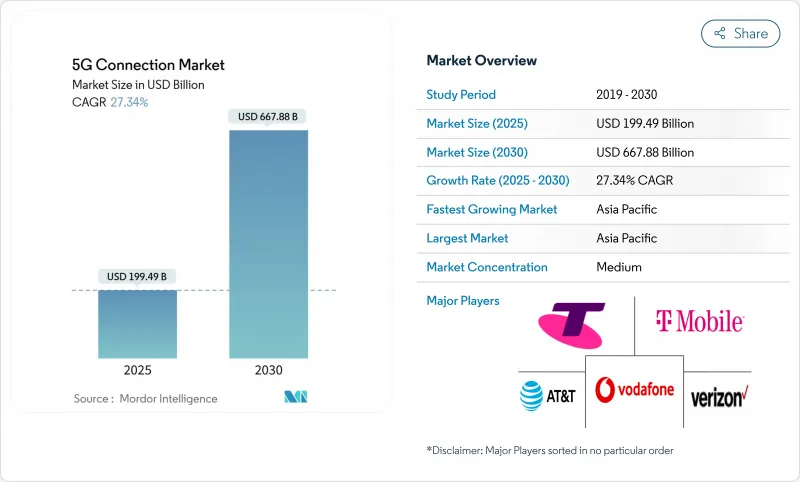
Commercial roll-outs have progressed from coverage expansion to network densification, enabling rapid adoption of advanced capabilities such as slicing, edge computing, and RedCap devices. Asia-Pacific accounts for 52% of global subscriptions thanks to China's 4.4 million base stations and India's nationwide standalone build-out, while North America leads in Fixed Wireless Access (FWA) penetration. Operators are accelerating the shift from non-standalone (NSA) to standalone (SA) cores as SA unlocks higher monetization potential, particularly for enterprise and ultra-reliable low-latency (URLLC) use cases. Private 5G networks in manufacturing, healthcare, and automotive are scaling quickly, and network-API marketplaces promise additional revenue streams in the near term. However, high mid-band spectrum prices, rural coverage economics, and fiber price wars continue to temper growth in selected regions.
Global 5G Connection Market Trends and Insights
Surge in mobile data traffic requiring higher-capacity networks
Monthly data usage per 5G line averages close to 70 GB-four times the 4G figure-fueled by cloud gaming and extended-reality services. China's 4.4 million 5G base stations illustrate the scale needed to carry this load, and mid-band spectrum remains vital, although only one quarter of non-Chinese sites currently deploy it. As traffic migrates, operators prioritize additional carrier aggregation, Massive MIMO upgrades, and dynamic spectrum sharing. These investments underpin revenue growth in the 5G connections market while raising the urgency to optimize network energy efficiency.
Fixed Wireless Access (FWA) emerging as mainstream broadband alternative
US operators collectively serve 11.5 million FWA lines, with projections of 20 million by 2028 as median download speeds exceed 200 Mbps. Operators in India aim for 30 million FWA subscribers by 2027 by exploiting cost advantages over limited fiber roll-outs. Verizon generated USD 452 million in Q1 2024 FWA revenue, demonstrating the format's near-term profitability. mmWave deployments increase urban capacity, and customer surveys show 44% preference for wireless home broadband. Collectively, these developments boost average revenue per user and broaden the 5G connections market addressable base.
High CAPEX and mid-band spectrum costs
Global infrastructure outlays will exceed USD 600 billion during 2022-2025, and European auctions drive disproportionate financing burdens that leave only 2% of regional operators with SA cores versus 80% in China. Emerging-market carriers postpone auctions and explore tower-sharing to mitigate rising leverage. Network sharing in Nordic economies shows positive examples, but capital pressures still curb full participation in the 5G connections market.
Other drivers and restraints analyzed in the detailed report include:
- Enterprise digitization and IoT accelerating 5G adoption
- Generative-AI-driven uplink surge spurring early 5G-SA roll-outs
- Rural coverage economics remain unattractive
For complete list of drivers and restraints, kindly check the Table Of Contents.
Segment Analysis
Mobile broadband accounted for 62% of the 5G connections market in 2024, underpinned by smartphone adoption and video consumption growth. At the same time, M2M and IoT links are expanding at a 28.63% CAGR, encouraged by private 5G network deployments across smart factories, hospitals, and logistics hubs. The enterprise tilt is materially increasing the 5G connections market size for network slicing, particularly as mission-critical communications and FWA subscriptions contribute incremental traffic. Hardware vendors have introduced RedCap chipsets that lower power draw for industrial sensors, accelerating M2M project viability. Edge-native architectures further catalyze M2M monetization as real-time analytics become table stakes in competitive manufacturing.
Continued proliferation of cellular IoT endpoints is projected to double device counts by 2028, creating relentless demand for cost-optimized modules and simplified onboarding tools. Mission-critical communication use cases, from FirstNet expansion in the US to nationwide public-safety networks in Korea, widen service differentiation opportunities. The resulting diversity cements a new equilibrium in which consumer traffic remains large, yet enterprise traffic captures the outsized share of future 5G connections market growth.
Consumer use retained 76% share of the 5G connections market size in 2024 as streaming and gaming sustained mobile broadband traffic. Nonetheless, enterprise lines will deliver a 30.47% CAGR through 2030, powered by digital-transformation mandates in automotive, healthcare, and energy. Manufacturing stands out: more than 1,000 active projects report 15-20% gains in line efficiency after switching to private 5G. Hospitals in Singapore and Sweden show reduced surgery times and enhanced patient outcomes once ultra-low-latency video links are integrated.
Smart-city programs are also deploying surveillance cameras, connected streetlights, and environmental monitors, each adding to the enterprise subscriber base. Utilities turn to 5G for real-time grid balancing, and oil-and-gas operators prioritize automated inspection drones. These converging drivers tilt long-term revenue concentration toward the enterprise, increasing average revenue per connection and deepening stickiness within the 5G connections market.
5G Connection Market Report is Segmented by Connection Type (Mobile Broadband, Fixed Wireless Access, and More), End-User (Consumer and Enterprise), Spectrum Band (Sub-1 GHz, 1-6 GHz, and More), Network Architecture (Non-Standalone and Standalone), Device Category (Smartphones and Tablets, FWA CPE, and More), Service Type (Enhanced Mobile Broadband (eMBB), Massive Machine-Type Communications (mMTC), and More), and Geography.
Geography Analysis
Asia-Pacific accounted for 52% of global subscriptions in 2024 and is forecast to grow at a 30.28% CAGR through 2030, led by China's 4.4 million base stations and India's rapid standalone expansion. China's digital-economy contribution is set to reach USD 2 trillion by 2030, reflecting widespread 5G platform adoption in manufacturing, retail, and services. India's Reliance Jio operates over 1 million cloud-native cell sites, while expected FWA lines could climb from 5 million to 30 million by 2027. Japan's and South Korea's early commercial 5G Advanced launches sustain regional innovation leadership, and Southeast Asia projects USD 130 billion in incremental GDP impact by 2030.
North America is a mature yet innovation-centric arena where 98% of the population already has 5G coverage. T-Mobile's nationwide SA deployment and 6.43 million FWA lines illustrate consumer and enterprise diversification. Verizon's satellite partnership with AST SpaceMobile seeks to close residual rural gaps, while Canadian and Mexican carriers integrate 5G Advanced features such as RedCap. Focus now turns to monetizing network APIs, edge compute, and AI-assisted service orchestration, driving higher revenue density per site across the 5G connections market.
Europe displays mixed progress: Germany, Denmark and Finland exceed 95% population coverage, yet only 2% of subscriptions run on SA cores. The United Kingdom's Vodafone-Three merger injects USD 14.86 billion into network upgrades aimed at rural inclusion, and Nordic spectrum-sharing models yield higher availability at lower cost. Continental operators now press regulators to streamline auctions and lower license fees to sustain investment cycles, seeking to close the SA gap and unlock greater value in the 5G connections market.
- AT&T Inc.
- Verizon Communications Inc.
- Vodafone Group Plc
- China Mobile Ltd.
- China Telecommunications Corp.
- T-Mobile US Inc.
- Telstra Corp. Ltd.
- Telefonica SA
- Deutsche Telekom AG
- Reliance Jio Infocomm Ltd.
- SK Telecom Co. Ltd.
- NTT Docomo Inc.
- KT Corp.
- Orange SA
- KDDI Corp.
- Bharti Airtel Ltd.
- Saudi Telecom Company (stc)
- Rakuten Mobile Inc.
- Etisalat by eand
- MTN Group Ltd.
Additional Benefits:
- The market estimate (ME) sheet in Excel format
- 3 months of analyst support
TABLE OF CONTENTS
1 INTRODUCTION
- 1.1 Study Assumptions and Market Definition
- 1.2 Scope of the Study
2 RESEARCH METHODOLOGY
3 EXECUTIVE SUMMARY
4 MARKET LANDSCAPE
- 4.1 Market Overview
- 4.2 Market Drivers
- 4.2.1 Surge in mobile data traffic requiring higher-capacity networks
- 4.2.2 Fixed Wireless Access (FWA) emerging as mainstream broadband alternative
- 4.2.3 Enterprise digitization and IoT accelerating 5G adoption
- 4.2.4 Generative-AI-driven uplink surge spurring early 5G-SA roll-outs
- 4.2.5 Monetization via Open-API ecosystems
- 4.3 Market Restraints
- 4.3.1 High CAPEX and mid-band spectrum costs
- 4.3.2 Rural coverage economics remain unattractive
- 4.3.3 Fiber price wars dampen urban FWA uptake
- 4.4 Value Chain Analysis
- 4.5 Regulatory Landscape
- 4.6 Technological Outlook
- 4.7 Porter's Five Forces Analysis
- 4.7.1 Bargaining Power of Suppliers
- 4.7.2 Bargaining Power of Buyers/Consumers
- 4.7.3 Threat of New Entrants
- 4.7.4 Threat of Substitutes
- 4.7.5 Intensity of Competitive Rivalry
5 MARKET SIZE AND GROWTH FORECASTS (VALUE)
- 5.1 By Connection Type
- 5.1.1 Mobile Broadband
- 5.1.2 Fixed Wireless Access
- 5.1.3 M2M and IoT
- 5.1.4 Mission-critical Communications
- 5.1.5 Private Networks
- 5.2 By End-user
- 5.2.1 Consumer
- 5.2.2 Enterprise
- 5.2.2.1 Manufacturing
- 5.2.2.2 Healthcare
- 5.2.2.3 Automotive and Transportation
- 5.2.2.4 Smart Cities and Public Safety
- 5.2.2.5 Energy and Utilities
- 5.2.2.6 Retail and Logistics
- 5.3 By Spectrum Band
- 5.3.1 Sub-1 GHz (Low-Band)
- 5.3.2 1-6 GHz (Mid-Band)
- 5.3.3 above 24 GHz (mmWave / High-Band)
- 5.4 By Network Architecture
- 5.4.1 Non-Standalone (NSA)
- 5.4.2 Standalone (SA)
- 5.5 By Device Category
- 5.5.1 Smartphones and Tablets
- 5.5.2 FWA CPE
- 5.5.3 IoT Modules and Gateways
- 5.5.4 Wearables and AR/VR Devices
- 5.5.5 Industrial Routers and Rugged Modules
- 5.6 By Service Type
- 5.6.1 Enhanced Mobile Broadband (eMBB)
- 5.6.2 Massive Machine-Type Communications (mMTC)
- 5.6.3 Ultra-Reliable Low-Latency Communications (URLLC)
- 5.7 By Geography
- 5.7.1 North America
- 5.7.1.1 United States
- 5.7.1.2 Canada
- 5.7.1.3 Mexico
- 5.7.2 South America
- 5.7.2.1 Brazil
- 5.7.2.2 Rest of South America
- 5.7.3 Europe
- 5.7.3.1 Germany
- 5.7.3.2 France
- 5.7.3.3 United Kingdom
- 5.7.3.4 Rest of Europe
- 5.7.4 Asia Pacific
- 5.7.4.1 China
- 5.7.4.2 India
- 5.7.4.3 Japan
- 5.7.4.4 South Korea
- 5.7.4.5 ASEAN
- 5.7.4.6 Rest of Asia Pacific
- 5.7.5 Middle East and Africa
- 5.7.5.1 Middle East
- 5.7.5.1.1 Saudi Arabia
- 5.7.5.1.2 UAE
- 5.7.5.1.3 Turkey
- 5.7.5.1.4 Rest of Middle East
- 5.7.5.2 Africa
- 5.7.5.2.1 South Africa
- 5.7.5.2.2 Nigeria
- 5.7.5.2.3 Rest of Africa
- 5.7.1 North America
6 COMPETITIVE LANDSCAPE
- 6.1 Market Concentration
- 6.2 Strategic Moves
- 6.3 Market Share Analysis
- 6.4 Company Profiles (includes Global level Overview, Market level overview, Core Segments, Financials as available, Strategic Information, Market Rank/Share for key companies, Products and Services, and Recent Developments)
- 6.4.1 AT&T Inc.
- 6.4.2 Verizon Communications Inc.
- 6.4.3 Vodafone Group Plc
- 6.4.4 China Mobile Ltd.
- 6.4.5 China Telecommunications Corp.
- 6.4.6 T-Mobile US Inc.
- 6.4.7 Telstra Corp. Ltd.
- 6.4.8 Telefonica SA
- 6.4.9 Deutsche Telekom AG
- 6.4.10 Reliance Jio Infocomm Ltd.
- 6.4.11 SK Telecom Co. Ltd.
- 6.4.12 NTT Docomo Inc.
- 6.4.13 KT Corp.
- 6.4.14 Orange SA
- 6.4.15 KDDI Corp.
- 6.4.16 Bharti Airtel Ltd.
- 6.4.17 Saudi Telecom Company (stc)
- 6.4.18 Rakuten Mobile Inc.
- 6.4.19 Etisalat by eand
- 6.4.20 MTN Group Ltd.
7 MARKET OPPORTUNITIES AND FUTURE OUTLOOK
- 7.1 White-space and Unmet-need Assessment

