
PUBLISHER: Mordor Intelligence | PRODUCT CODE: 1851132

PUBLISHER: Mordor Intelligence | PRODUCT CODE: 1851132
High Altitude Pseudo Satellites - Market Share Analysis, Industry Trends & Statistics, Growth Forecasts (2025 - 2030)
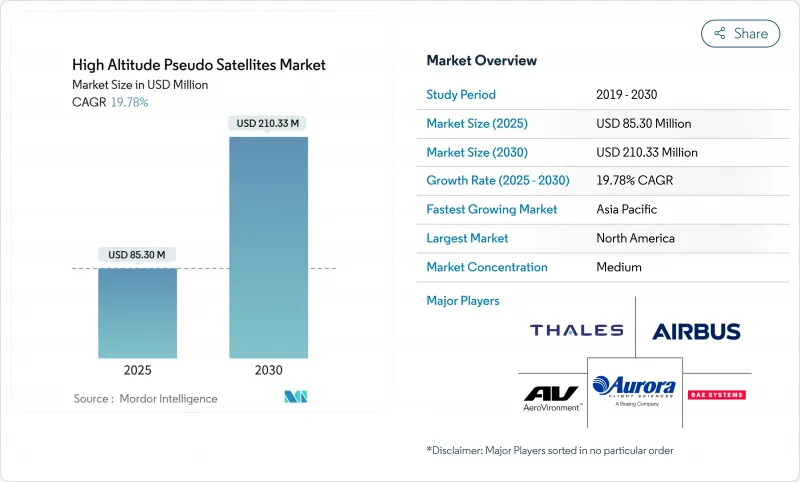
The high-altitude pseudo-satellite (HAPS) market size reached USD 85.30 million in 2025 and is forecasted to expand to USD 210.33 million by 2030, advancing at a 19.78% CAGR.
Rapid progress in 5G/6G non-terrestrial networks, escalating intelligence-surveillance budgets, and sustained advances in ultra-light solar and battery systems are reshaping platform economics, positioning the HAPS market as a cost-effective bridge between terrestrial towers and low-Earth-orbit constellations. Operators are capitalizing on 69% lower transmission costs versus LEO satellites, significantly reduced latency, and the ability to station-keep above 18 to 25 kilometers for months. Platform makers prioritize vertical integration-owning the aircraft, payload, and data services-to shorten time-to-market and meet sovereign digital-infrastructure mandates. Meanwhile, Europe, North America, and Asia-Pacific regulators have opened higher-altitude corridors, creating a clear procedural pathway for commercial flights at FL550 and above.
Global High Altitude Pseudo Satellites Market Trends and Insights
Rapid 5G/6G NTN roll-outs
Standardization of high-altitude platforms under 3GPP Release 17 unlocked direct-to-device functionality, giving the HAPS market a tangible boost.NTT DOCOMO's March 2025 demonstration in Kenya delivered 4.66 Mbps downlink to ordinary smartphones at 20 kilometers, validating commercial performance. Saudi Arabia's CST launched a dedicated NTN program, while Japan financed Beyond-5G HAPS research through NICT, showing multi-government alignment. Equipment vendors are now bundling terrestrial core software with HAPS radios, shortening deployment cycles. These moves accelerate spectrum auctions and create first-mover advantages for operators that can field stratospheric coverage before LEO competitors saturate the rural broadband market.
Growing ISR and persistent surveillance outlays
The US National Defense Authorization Act (NDAA) 2024 earmarked fresh funds for ultra-long-endurance HAPS, confirming defense agencies' willingness to shift part of their satellite spend toward stratospheric assets. India's 2024-25 budget followed suit, listing high-altitude platforms among priority procurements for the Ministry of Defence. BAE Systems flight-tested its PHASA-35 in 2024, carrying a 15 kg ISR payload for multi-week sorties.Continuous coverage at a fraction of satellite cost has prompted joint European border-security pilots under Frontex, while Asian militaries are scoping maritime-domain-awareness packages. As defense users validate the platforms, dual-use suppliers gain scale economies that strengthen commercial propositions.
High CAPEX and maintenance cost per flight-hour
Platform builds priced at USD 4 to 7 million and specialized hangar requirements raise the entry bar for smaller players. Extended sorties necessitate reinforced structures that withstand radiation and -90 °C stratospheric temperatures, driving material costs. Maintenance activities-especially post-flight inspection of composite skins-are labor-intensive and can exceed USD 4,000 per aircraft-day. Insurance products remain limited; hull premiums are still priced at a high perceived risk due to the small global fleet size. Until volume production lowers unit cost, CAPEX will constrain deployments in low-ARPU regions.
Other drivers and restraints analyzed in the detailed report include:
- Cost advantage over LEO constellations
- Advances in ultra-light solar/battery systems
- Spectrum and airspace regulatory complexity
For complete list of drivers and restraints, kindly check the Table Of Contents.
Segment Analysis
Unmanned aerial vehicles (UAVs) led with 65.10% of the HAPS market share in 2024, a position built on precise station-keeping, rapid launch cycles, and mature autonomous-flight software. Stratospheric balloons retained a solid niche to lower development costs, while airships remained the fastest-growing sub-segment with a 26.40% CAGR projected to 2030 as operators target heavier multi-sensor payloads. From 2019 to 2024, UAVs consolidated leadership by proving consistent link budgets for broadband backhaul, persistent ISR, and high-resolution imaging-all within a single hardware baseline that can be re-tasked in hours instead of weeks. The HAPS market benefits because platform owners can shift craft from disaster response to telecom backhaul without structural modification, tightening utilisation rates, and improving return on capital.
Hybrid designs that combine balloon lift with airship thrusters are emerging, capturing early fleet orders from disaster-response agencies needing rapid launch and dynamic repositioning. Sceye's 24-meter-long demonstrator logged a 45-day methane-mapping mission for NASA in late 2024, carrying a 150 kg hyperspectral suite. The HAPS industry also experimented with rigid-wing UAVs; Swift Engineering's SULE offers near-satellite pointing accuracy for telecom payloads but at lower lift. Competition among architectures spurs material-science innovation, ultimately lowering the cost-per-bit for air-launched payloads.
Communication services held 40.65% of the HAPS market size in 2024, underpinned by direct-to-device pilots in Japan, the United States, and Kenya. Earth-observation demand is rising faster as multiband imagers deliver 5-centimeter GSD across 1,000-kilometer sweeps, lowering revisit intervals versus 500-kilometer LEO passes. ISR remained pivotal for defense customers, but the highest 22.35% CAGR belongs to commercial connectivity, where platforms are being slotted into mobile-edge architectures to offload rural traffic.
From 2019-2024, the mix was heavily skewed toward military trials; in 2025-2030, enterprise use cases such as agricultural analytics, wildfire detection, and rail-corridor monitoring will account for a larger share of service revenue. The HAPS market benefits because payload makers are packaging sensors with onboard AI accelerators, compressing analysis windows from hours to seconds. Navigation and positioning pilots in Japan revealed that adding a pseudolite beacon can enhance GNSS accuracy by 45% in deep-urban canyons.
The High-Altitude Pseudo-Satellites (HAPS) Market Report is Segmented by Technology (Stratospheric Balloons, Unmanned Aerial Vehicles, and Airships), Application (Communication and Connectivity, and More), End-User (Government and Defense, Commercial Enterprises, and More), Power Source (Solar-Electric, Battery, and More), and Geography (North America, Europe, and More). The Market Forecasts are Provided in Terms of Value (USD).
Geography Analysis
North America accounted for 33.97% of 2024 revenue, aided by FAA traffic-management frameworks and strong R&D spending by NASA and the US Space Force. AeroVironment posted USD 717 million in fiscal 2024 sales, up 33%, reflecting defense demand for unmanned systems that include high-altitude prototypes. States such as Arizona and New Mexico have also allocated tax incentives for HAPS assembly facilities, reinforcing regional supply-chain depth.
Asia-Pacific is projected to expand at 24.96% CAGR through 2030, the fastest among all regions, elevating the HAPS market profile across Japan, India, and Australia. Japan's USD 100 million AALTO consortium deal in 2024 paved the way for 2026 commercial launches, while SoftBank earmarked 2027 for mass-market roll-out. India's CSIR-NAL completed pseudo-satellite airtime tests that align with its spectrum road map for 6G field trials. South Korea and Australia are co-funding tech demonstrators at Arctic and maritime coverage gaps elsewhere.
Europe holds a sizeable installed base and is advancing standard-setting. EASA's Higher Airspace Operations blueprint set 2027 as the target for unified certification, while ESA's TELEO project is funding both aerostatic and aerodynamic demonstrators. The region's climate-policy tilt favors zero-emission backhaul, further supporting adoption. Member states like France and Spain are piloting HAPS for wildfire monitoring, showing that environmental applications can dovetail with telecom use cases to build volume.
- AeroVironment, Inc.
- Airbus SE
- BAE Systems plc
- Thales Group
- Aerostar LLC
- Mira Aerospace Ltd.
- Sceye Inc.
- Stratosyst s.r.o.
- Involve Space S.R.L.
- HAPSMobile Inc. (SoftBank Corp.)
- Aurora Flight Sciences (The Boeing Company)
- Avealto Limited
- Zero 2 Infinity, S.L.
- Kea Aerospace Limited
- Stratospheric Platforms Ltd.
- Atlas LTA Advanced Technology, Ltd.
- Sierra Nevada Company, LLC.
- Maraal Aerospace Pvt. Ltd.
- Voltitude Ltd.
Additional Benefits:
- The market estimate (ME) sheet in Excel format
- 3 months of analyst support
TABLE OF CONTENTS
1 INTRODUCTION
- 1.1 Study Assumptions
- 1.2 Scope of the Study
2 RESEARCH METHODOLOGY
3 EXECUTIVE SUMMARY
4 MARKET LANDSCAPE
- 4.1 Market Overview
- 4.2 Market Drivers
- 4.2.1 Rapid 5G/6G NTN roll-outs
- 4.2.2 Growing ISR and persistent surveillance outlays
- 4.2.3 Cost advantage over LEO constellations
- 4.2.4 Advances in ultra-light solar/battery systems
- 4.2.5 Carbon-reduction mandates favoring low-emission rural backhaul
- 4.2.6 Stratospheric air-traffic corridors opened by regulators
- 4.3 Market Restraints
- 4.3.1 High CAPEX and maintenance cost per flight-hour
- 4.3.2 Spectrum and airspace regulatory complexity
- 4.3.3 Stratospheric wind-shear unpredictability
- 4.3.4 Insurance and liability gaps for more than 30-day unmanned sorties
- 4.4 Value Chain Analysis
- 4.5 Regulatory Landscape
- 4.6 Technological Outlook
- 4.7 Porter's Five Forces Analysis
- 4.7.1 Bargaining Power of Suppliers
- 4.7.2 Bargaining Power of Buyers
- 4.7.3 Threat of New Entrants
- 4.7.4 Threat of Substitutes
- 4.7.5 Intensity of Competitive Rivalry
5 MARKET SIZE AND GROWTH FORECASTS (VALUE)
- 5.1 By Technology
- 5.1.1 Stratospheric Balloons
- 5.1.2 Unmanned Aerial Vehicles
- 5.1.3 Airships
- 5.2 By Application
- 5.2.1 Communication and Connectivity
- 5.2.2 Intelligence, Surveillance and Reconnaissance (ISR)
- 5.2.3 Earth Observation and Climate Monitoring
- 5.2.4 Navigation and Positioning
- 5.2.5 Scientific and Research Missions
- 5.3 By End-User
- 5.3.1 Government and Defense
- 5.3.2 Commercial Enterprises
- 5.3.3 Research Institutions
- 5.4 By Power Source
- 5.4.1 Solar-Electric
- 5.4.2 Hybrid Hydrogen-Fuel-Cell
- 5.4.3 Battery
- 5.5 By Geography
- 5.5.1 North America
- 5.5.1.1 United States
- 5.5.1.2 Canada
- 5.5.1.3 Mexico
- 5.5.2 Europe
- 5.5.2.1 United Kingdom
- 5.5.2.2 France
- 5.5.2.3 Germany
- 5.5.2.4 Italy
- 5.5.2.5 Rest of Europe
- 5.5.3 Asia-Pacific
- 5.5.3.1 China
- 5.5.3.2 India
- 5.5.3.3 Japan
- 5.5.3.4 Australia
- 5.5.3.5 South Korea
- 5.5.3.6 Rest of Asia-Pacific
- 5.5.4 South America
- 5.5.4.1 Brazil
- 5.5.4.2 Rest of South America
- 5.5.5 Middle East and Africa
- 5.5.5.1 Middle East
- 5.5.5.1.1 Saudi Arabia
- 5.5.5.1.2 United Arab Emirates
- 5.5.5.1.3 Turkey
- 5.5.5.1.4 Rest of Middle East
- 5.5.5.2 Africa
- 5.5.5.2.1 South Africa
- 5.5.5.2.2 Rest of Africa
- 5.5.1 North America
6 COMPETITIVE LANDSCAPE
- 6.1 Market Concentration
- 6.2 Strategic Moves
- 6.3 Market Share Analysis
- 6.4 Company Profiles (includes Global-level Overview, Market-level Overview, Core Segments, Financials, Strategic Information, Market Rank / Share, Products and Services, Recent Developments)
- 6.4.1 AeroVironment, Inc.
- 6.4.2 Airbus SE
- 6.4.3 BAE Systems plc
- 6.4.4 Thales Group
- 6.4.5 Aerostar LLC
- 6.4.6 Mira Aerospace Ltd.
- 6.4.7 Sceye Inc.
- 6.4.8 Stratosyst s.r.o.
- 6.4.9 Involve Space S.R.L.
- 6.4.10 HAPSMobile Inc. (SoftBank Corp.)
- 6.4.11 Aurora Flight Sciences (The Boeing Company)
- 6.4.12 Avealto Limited
- 6.4.13 Zero 2 Infinity, S.L.
- 6.4.14 Kea Aerospace Limited
- 6.4.15 Stratospheric Platforms Ltd.
- 6.4.16 Atlas LTA Advanced Technology, Ltd.
- 6.4.17 Sierra Nevada Company, LLC.
- 6.4.18 Maraal Aerospace Pvt. Ltd.
- 6.4.19 Voltitude Ltd.
7 MARKET OPPORTUNITIES AND FUTURE OUTLOOK
- 7.1 White-space and Unmet-Need Assessment

