
PUBLISHER: Mordor Intelligence | PRODUCT CODE: 1851144

PUBLISHER: Mordor Intelligence | PRODUCT CODE: 1851144
3D Projector - Market Share Analysis, Industry Trends & Statistics, Growth Forecasts (2025 - 2030)
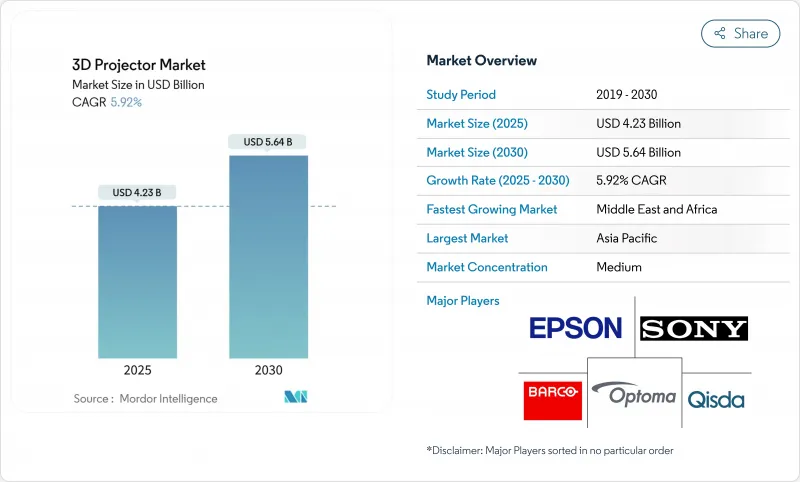
The 3D projector market is valued at USD 4.23 billion in 2025 and is forecast to reach USD 5.64 billion by 2030, advancing at a 5.92% CAGR.
Progress continues despite growing interest in direct-view LED because laser illumination, advanced image processors and falling cost-per-lumen keep projection competitive for both fixed and portable uses. High-brightness laser platforms dominate professional venues, while battery-powered pico models gain traction in home entertainment and pop-up retail. Demand for 4K resolution and >=10,000-lumen systems is expanding fastest as venues seek brighter, sharper images that stand up to ambient light. At the same time, e-commerce is changing how buyers research and procure equipment, pushing manufacturers to simplify installation and offer richer online product data.
Global 3D Projector Market Trends and Insights
Proliferation of Laser-Phosphor Light Sources Enhancing TCO in Pro-AV Installations
Laser-phosphor illumination extends operating life to roughly 20,000 hours, slashes lamp-replacement downtime, and can trim total cost of ownership by 40% compared with legacy lamps. Professional venues leverage this stability to negotiate longer fixed-price service contracts and reduce mid-show failures. Consistent brightness and color over the projector's life also improves brand standards for franchise cinema chains and touring productions. As laser pricing falls, channel partners bundle longer warranties that further de-risk capital outlays. These economics will keep laser platforms at the center of premium venue upgrades through the medium term, reinforcing a quality gap over lamp-based rivals in corporate, education, and entertainment settings.
Rapid Expansion of Immersive Theme Parks and Attractions in China and GCC
Large-format attractions in Shanghai, Dubai, and Riyadh increasingly specify multi-projector arrays exceeding 10,000 lumens per unit to deliver floor-to-ceiling visuals. Such projects fuel a 7.5% CAGR for the high-brightness tier, with suppliers like BenQ offering 4K simulation models fitted with proprietary dust-proofing to handle desert climates. Premium installs set new visual benchmarks that ripple into corporate innovation centers and higher-education labs. Content creators likewise shift pipelines toward higher resolutions and frame rates to match these brighter canvases, reinforcing hardware demand.
Direct-View LED Walls Cannibalizing Premium Cinema Screens
LED cinema displays deliver uniform brightness, high contrast, and no projection booth requirements, making them attractive for new construction. They circumvent issues such as polarization-related dimming in 3D presentation, reducing the functional advantage of projection. Capital costs remain higher, yet some multiplex operators justify the spend by repurposing freed-up booth space for additional seats or retail concessions. As LED pixel pitch tightens and price curves descend, projector vendors must sharpen differentiation in TCO and color accuracy to defend marquee auditoriums.
Other drivers and restraints analyzed in the detailed report include:
- Government-Backed Smart Classroom 3D Deployments across India and ASEAN
- Revival of 4K-HDR 3D Movie Releases by Hollywood and Chinese Studios
- Motion Sickness and Eye-Fatigue Concerns in Education Use-Cases
For complete list of drivers and restraints, kindly check the Table Of Contents.
Segment Analysis
Digital Light Processing maintained 58% of the 3D projector market share in 2024, reflecting its strong contrast and compact optical engine. The segment benefits from a mature component supply chain that keeps costs predictable for integrators. LCOS, however, is posting a 6.1% CAGR as design studios and premium home cinemas value its reduced screen-door effect and smoother images. Competitive positioning is becoming application-specific; DLP often prevails in portable and rental fleets, whereas LCOS secures high-fidelity simulators.
LCOS shipments will keep eroding DLP's lead in scenarios where pixel density and color uniformity outweigh absolute brightness. Yet, the total 3D projector market size tied to DLP platforms is expected to stay significant through 2030 because deep channel inventories, firmware familiarity, and accessory ecosystems favor continuity. LCD remains relevant in cost-sensitive education tenders, though price gaps versus entry-level DLP are narrowing as laser engines head down-market.
Laser units captured 46.5% of revenue in 2024, a clear signal that professional venues now prioritise maintenance-free operation over lower first cost. Vendor roadmaps increasingly differentiate between pure RGB systems for flagship auditoriums and laser-phosphor hybrids that balance cost and color gamut. The 3D projector market size for laser models is forecast to expand alongside falling diode prices and wider acceptance of 120-volt compatibility, which eases electrical planning news.epson.com.
LED's 8.3% CAGR owes much to the portable and pico boom. Battery operation, near-instant on/off, and low thermals create user experiences that rival smart TVs, especially when paired with integrated streaming. Lamp-based products now cater almost exclusively to budget buyers who prioritise low acquisition cost over lifetime economics, and their share will continue declining as emerging markets leapfrog straight to solid-state illumination.
Full-HD kept 38.7% revenue share in 2024 because it balances clarity with bandwidth and content availability. Nevertheless, 4K/UHD shipments are climbing at 7.2% CAGR as enterprises and universities invest in higher-resolution collaboration spaces. Native-4K chips remain pricey, so brands deploy pixel-shift technologies such as JVC's e-shiftX to deliver near-4K acuity at lower bit-rate overheads.
Above-4K, early 8K models serve as halo products, sustaining R&D in optics and image processing. While the 3D projector market share above 4K is small today, these flagships shape buyer expectations and provide technology trickle-down benefits to mid-tier lines over time.
The 3D Projector Market Report is Segmented by Technology (DLP, LCD, LCOS), Light Source (Laser, LED, and More), Resolution (HD, Full-HD, and More), Brightness (Less Than 2000, 2000-3999, and More), Design (Fixed Installation, Portable/Pico), End-User Application (Cinema, Education, and More), Sales Channel (Direct, Distributors and VARs, and E-Commerce), and Geography. The Market Forecasts are Provided in Terms of Value (USD).
Geography Analysis
Asia Pacific led with 42.1% revenue in 2024, driven by China's premium theme-park pipeline and India's public-sector education programs. Chinese integrators source >10,000-lumen lasers for immersive rides, while Indian tenders specify mid-range interactive models for STEM labs, lifting regional shipments across price bands. Japan's dense urban housing supports strong home-theatre uptake, reinforcing portable growth.
The Middle East and Africa post the highest 7.1% CAGR to 2030. GCC governments embed projection into cultural mega-projects and digital classrooms, often mandating RGB laser for marquee attractions. Saudi Arabia's entertainment build-out accelerates demand for >=20,000-lumen rigs able to withstand desert dust without external chillers. Content localization lags hardware rollouts, yet fiber upgrades and local studios are narrowing the gap.
North America and Europe see steady replacement demand as operators swap lamps for lasers to reduce service costs. Corporate users outfit metaverse visualization rooms that synergize with broader digital-twin strategies. Latin America remains challenged by currency swings, though Brazil's cinema chains still prioritize projector upgrades over LED due to lower site-fit costs.
- Seiko Epson Corp.
- Sony Corp.
- Barco NV
- BenQ Corp. (Qisda)
- Optoma Corp. (Coretronic)
- Christie Digital (Ushio)
- NEC Display Solutions (Sharp-NEC)
- Panasonic Connect Co.
- ViewSonic Corp.
- InFocus Corp.
- Delta Electronics (Vivitek)
- Acer Inc.
- LG Electronics
- Hitachi Digital Media
- Xiaomi Corp.
- Casio Computer Co.
- AAXA Technologies
- Hisense Visual Tech
- JVC Kenwood Corp.
- Opto-Tech (Vivitek-s OEM)
Additional Benefits:
- The market estimate (ME) sheet in Excel format
- 3 months of analyst support
TABLE OF CONTENTS
1 INTRODUCTION
- 1.1 Study Assumptions and Market Definition
- 1.2 Scope of the Study
2 RESEARCH METHODOLOGY
3 EXECUTIVE SUMMARY
4 MARKET LANDSCAPE
- 4.1 Market Overview
- 4.2 Market Drivers
- 4.2.1 Proliferation of Laser-Phosphor Light Sources Enhancing TCO in Pro-AV Installations (NA and EU)
- 4.2.2 Rapid Expansion of Immersive Theme Parks and Attractions in China and Gulf Cooperation Council Countries
- 4.2.3 Government-backed Smart Classroom 3D Deployments across India and ASEAN
- 4.2.4 Revival of 4K-HDR 3D Movie Releases by Hollywood and Chinese Studios
- 4.2.5 Growth of Enterprise Metaverse Visualization Rooms in Automotive and Aerospace
- 4.2.6 Falling Price-per-Ansi-Lumen Driving Urban Home-Theatre Adoption in Japan
- 4.3 Market Restraints
- 4.3.1 Direct-View LED Walls Cannibalizing Premium Cinema Screens
- 4.3.2 Motion Sickness and Eye-Fatigue Concerns in Education Use-cases
- 4.3.3 Limited 3D Content Distribution Infrastructure in Emerging Markets
- 4.3.4 Higher Capex of Laser 3D Projectors for Small Independent Cinemas in EU
- 4.4 Industry Ecosystem Analysis
- 4.5 Regulatory and Technological Outlook
- 4.6 Porter's Five Forces Analysis
- 4.6.1 Threat of New Entrants
- 4.6.2 Bargaining Power of Buyers
- 4.6.3 Bargaining Power of Suppliers
- 4.6.4 Threat of Substitutes
- 4.6.5 Intensity of Competitive Rivalry
5 MARKET SIZE AND GROWTH FORECASTS (VALUES)
- 5.1 By Technology
- 5.1.1 DLP (Digital Light Processing)
- 5.1.2 LCD
- 5.1.3 LCOS
- 5.2 By Light Source
- 5.2.1 Laser (Solid-State and Laser-Phosphor)
- 5.2.2 LED
- 5.2.3 Lamp-Based
- 5.2.4 Hybrid/Phosphor-LED
- 5.3 By Resolution
- 5.3.1 HD (<=720p)
- 5.3.2 Full-HD (1080p)
- 5.3.3 4K/UHD
- 5.3.4 8K and Above
- 5.4 By Brightness (ANSI Lumens)
- 5.4.1 Less than 2,000
- 5.4.2 2,000-3,999
- 5.4.3 4,000-9,999
- 5.4.4 >=10,000
- 5.5 By Design
- 5.5.1 Fixed Installation
- 5.5.2 Portable/Pico
- 5.6 By End-user Application
- 5.6.1 Cinema
- 5.6.2 Education
- 5.6.3 Home Theatre and Gaming
- 5.6.4 Business and Corporate
- 5.6.5 Events and Large Venues
- 5.6.6 Other Applications
- 5.7 By Sales Channel
- 5.7.1 Direct (B2B/OEM)
- 5.7.2 Distributors and VARs
- 5.7.3 E-Commerce
- 5.8 By Geography
- 5.8.1 North America
- 5.8.1.1 United States
- 5.8.1.2 Canada
- 5.8.1.3 Mexico
- 5.8.2 Europe
- 5.8.2.1 Germany
- 5.8.2.2 United Kingdom
- 5.8.2.3 France
- 5.8.2.4 Italy
- 5.8.2.5 Spain
- 5.8.2.6 Russia
- 5.8.2.7 Rest of Europe
- 5.8.3 Asia-Pacific
- 5.8.3.1 China
- 5.8.3.2 Japan
- 5.8.3.3 South Korea
- 5.8.3.4 India
- 5.8.3.5 ASEAN
- 5.8.3.6 Rest of Asia-Pacific
- 5.8.4 South America
- 5.8.4.1 Brazil
- 5.8.4.2 Argentina
- 5.8.4.3 Rest of South America
- 5.8.5 Middle East and Africa
- 5.8.5.1 Saudi Arabia
- 5.8.5.2 United Arab Emirates
- 5.8.5.3 Turkey
- 5.8.5.4 South Africa
- 5.8.5.5 Rest of Middle East and Africa
- 5.8.1 North America
6 COMPETITIVE LANDSCAPE
- 6.1 Market Concentration
- 6.2 Strategic Moves
- 6.3 Market Share Analysis
- 6.4 Company Profiles (includes Global level Overview, Market level overview, Core Segments, Financials as available, Strategic Information, Market Rank/Share for key companies, Products and Services, and Recent Developments)
- 6.4.1 Seiko Epson Corp.
- 6.4.2 Sony Corp.
- 6.4.3 Barco NV
- 6.4.4 BenQ Corp. (Qisda)
- 6.4.5 Optoma Corp. (Coretronic)
- 6.4.6 Christie Digital (Ushio)
- 6.4.7 NEC Display Solutions (Sharp-NEC)
- 6.4.8 Panasonic Connect Co.
- 6.4.9 ViewSonic Corp.
- 6.4.10 InFocus Corp.
- 6.4.11 Delta Electronics (Vivitek)
- 6.4.12 Acer Inc.
- 6.4.13 LG Electronics
- 6.4.14 Hitachi Digital Media
- 6.4.15 Xiaomi Corp.
- 6.4.16 Casio Computer Co.
- 6.4.17 AAXA Technologies
- 6.4.18 Hisense Visual Tech
- 6.4.19 JVC Kenwood Corp.
- 6.4.20 Opto-Tech (Vivitek-s OEM)
7 MARKET OPPORTUNITIES AND FUTURE OUTLOOK
- 7.1 White-space and Unmet-Need Assessment

