
PUBLISHER: Mordor Intelligence | PRODUCT CODE: 1851380

PUBLISHER: Mordor Intelligence | PRODUCT CODE: 1851380
Methanol - Market Share Analysis, Industry Trends & Statistics, Growth Forecasts (2025 - 2030)
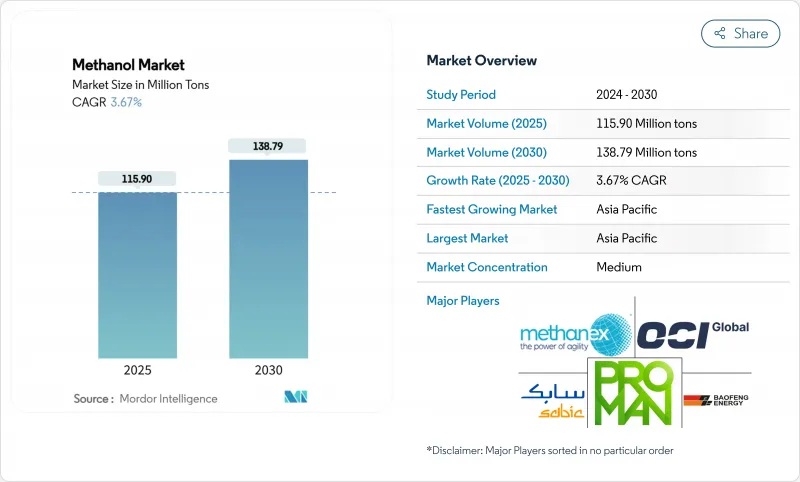
The Methanol Market size is estimated at 115.90 Million tons in 2025, and is expected to reach 138.79 Million tons by 2030, at a CAGR of 3.67% during the forecast period (2025-2030).
The headline figures hide sharp regional contrasts: Atlantic basin prices firmed after unplanned outages, while Asian spot prices softened, widening arbitrage windows for traders. China's expanding methanol-to-olefins (MTO) capacity, North American "mega-mega" plants, and surging marine-fuel demand anchor the growth narrative. Renewable methanol projects offer sizeable upside, yet certification lags and infrastructure gaps restrict near-term supply build-out. Feedstock volatility and uneven policy support add complexity, but sustained investment in low-carbon production and shipping conversions underpin a steady medium-term trajectory for the methanol market.
Global Methanol Market Trends and Insights
Expanding Petrochemical Capacity in China, US and Emerging Asia
Record crude throughput of 14.8 million bpd at Chinese integrated complexes in 2024 has raised methanol demand as refiners pivot toward chemical feedstocks. Concurrently, purpose-built US "mega-mega" methanol plants are geared to serve Chinese MTO units, forging a trans-Pacific value chain that recasts traditional trade flows. Emerging Asian producers are replicating this model, with several coal-to-methanol investments under construction. These projects collectively lift regional self-sufficiency, yet they also keep incremental demand firmly tethered to methanol market fundamentals. The dynamic is expected to add around 8 million tons of new consumption by 2030, cementing Asia-Pacific's centrality to global balances.
Marine Sector Transition to Low-Carbon Fuels
Methanol displaced LNG as the leading alternative fuel for newbuilds in 2023, when 138 methanol-capable vessels were ordered versus 130 LNG-ready ships. In early 2025, the orderbook grew by a further 23 ships, and major carriers such as Maersk now target 25 dual-fuel containerships on the water by 2027, potentially abating 1.5 million tCO2 each year. Renewable methanol can cut lifecycle greenhouse-gas emissions by up to 95%, aligning with the IMO's 2024 life-cycle intensity guidelines. The rapid pace of vessel commitments has outstripped realized fuel supply, underpinning firm demand expectations and reinforcing the long-term pull on the methanol market.
Feedstock Price Volatility
Natural-gas prices swung sharply in 2024 as geopolitical tensions affected European and Asian LNG benchmarks, inflating methanol production costs in import-dependent regions. Producers without secure gas supply, notably in Europe, faced compressed margins relative to plants in North America and the Middle East. The methanol market remains exposed to these swings because natural gas still accounts for 65% of feedstock. Volatility also complicates investment decisions for new capacity and hampers price transparency for downstream buyers. While hedging and integration strategies partly offset the risk, persistent instability tempers near-term growth prospects.
Other drivers and restraints analyzed in the detailed report include:
- Government Mandates on Blended Fuels in ASEAN & LATAM
- Increasing Utilization of Methanol in the Production of Olefins
- Slow Certification Frameworks for Green Methanol
For complete list of drivers and restraints, kindly check the Table Of Contents.
Segment Analysis
Natural gas accounted for 65% of total feedstock in 2024. Robust shale production in the Haynesville and Permian regions underpins cost-competitive output, ensuring reliable supply for the methanol market size. Renewable pathways-biomethanol and e-methanol-together represent 210 announced projects with potential capacity of 35.7 million t by 2030, signalling an incipient shift in the methanol industry.
Natural gas is projected to remain the anchor feedstock through 2030, but its share gradually contracts as certified green alternatives secure premiums from shipping and chemical customers. The methanol market benefits from this dual-track growth: conventional players capitalize on feedstock advantage, while early adopters of renewable technologies command higher margins and brand differentiation.
Energy-related uses-including MTO, gasoline blending and marine fuel-captured 54% of consumption in 2024, underscoring their influence on methanol market dynamics. The methanol-to-olefins boom in China alone absorbed an incremental 4 million t in 2024, reinforcing the region's pull on global trade.
Although currently modest in tonnage, marine fuel demand holds a significant share. Dual-fuel tonnage on order implies an additional 7 million t of annual bunker demand by 2030, indicating that the methanol market size for marine applications could rival existing energy uses. The versatility of methanol across fuels and chemicals thus smooths cyclical swings, enhancing the sector's resilience.
The Methanol Market Report Segments the Industry by Feedstock (Natural Gas, Coal, and More), Derivative/Application (Traditional Chemical and Energy Related), End-Use Industry (Automotive and Transportation, Chemical, and More), Grade (Chemical Grade, Fuel Grade, and More), and Geography (Asia-Pacific, North America, Europe, South America, and Middle East and Africa). The Market Forecasts are Provided in Terms of Volume (tons).
Geography Analysis
Asia-Pacific held a commanding 78% of global methanol consumption in 2024, equal to almost 90,400 kilotons. China's coal-to-olefins build-out, Indonesia's biodiesel B40 rollout and Southeast Asia's planned capacity additions cement regional leadership. The methanol market size in Asia-Pacific is forecast to grow at 3.86% CAGR to 2030 as new demand nodes from shipping and renewable fuels augment petrochemical requirements. Regional pricing remains closely tied to Chinese import parity, making the area the bellwether for global sentiment.
North America's role in the methanol market is undergoing transformation. Abundant shale gas underwrites a wave of export-oriented projects, typified by Lake Charles Methanol's USD 3.2 billion complex in Louisiana. US output, once mainly for domestic formaldehyde, is now squarely aimed at Asian MTO buyers, realigning trade corridors and providing arbitrage optionality.
Europe and the Middle East illustrate divergent strategies. Europe channels investment into e-methanol to meet "Fit for 55" goals, with projects such as Forestal del Atlantico's Spanish plant targeting shipping bunkers. Conversely, the Middle East doubles down on conventional natural-gas-based facilities, leveraging feedstock advantage to supply Asia. Together, these regions shape an increasingly bifurcated methanol market: one side chasing low-carbon premiums, the other maximizing cost leadership.
- Atlantic Methanol
- BASF SE
- Carbon Recycling International (CRI)
- Celanese Corporation
- China National Chemical Corporation (ChemChina)
- Coogee
- Enerkem
- Eni S.p.A.
- Gujarat State Fertilizers & Chemicals Limited (GSFC)
- INEOS
- Kaveh Methanol Company
- Kingboard Holdings Limited
- LyondellBasell Industries Holdings B.V.
- Methanex Corporation
- MITSUBISHI GAS CHEMICAL COMPANY, INC
- Natgasoline
- Ningxia Baofeng Energy Group
- OCI
- Petroliam Nasional Berhad (PETRONAS)
- Proman
- SABIC
- Yankuang Energy
- ZPC Integrated Refining & Petrochemical (Zhejiang)
Additional Benefits:
- The market estimate (ME) sheet in Excel format
- 3 months of analyst support
TABLE OF CONTENTS
1 Introduction
- 1.1 Study Assumptions and Market Definition
- 1.2 Scope of the Study
2 Research Methodology
3 Executive Summary
4 Market Landscape
- 4.1 Market Overview
- 4.2 Market Drivers
- 4.2.1 Expanding Petrochemical Capacity in China, US, and Emerging Asia
- 4.2.2 Marine Sector Transition to Low-Carbon Fuels - Adoption of Green Methanol by Global Carriers
- 4.2.3 Government Mandates on Blended Fuels in ASEAN and LATAM Promoting Methanol Gasoline and DME
- 4.2.4 Increasing Utilization of Methanol in the Production of Olefins
- 4.2.5 On-Purpose Propylene Deficit Strengthening Demand for Methanol-Based Routes in the Middle East
- 4.3 Market Restraints
- 4.3.1 Feedstock Price Volatility
- 4.3.2 Slow Certification Frameworks for Green Methanol Limiting Off-take Agreements
- 4.3.3 Hazardous Impacts on Health
- 4.4 Value Chain Analysis
- 4.5 Technological Outlook
- 4.6 Porter's Five Forces
- 4.6.1 Bargaining Power of Suppliers
- 4.6.2 Bargaining Power of Buyers
- 4.6.3 Threat of New Entrants
- 4.6.4 Threat of Substitute Products and Services
- 4.6.5 Degree of Competition
- 4.7 Production Capacity Analysis by Key Feedstock
- 4.8 Trade Flow Analysis
- 4.9 Pricing Trends and Forecasts
5 Market Size and Growth Forecasts (Volume and Value)
- 5.1 By Feedstock
- 5.1.1 Natural Gas
- 5.1.2 Coal
- 5.1.3 Renewable Feedstock (Biomass, Municipal Solid Waste)
- 5.1.4 Others (CO2, Green Hydrogen, Petroleum Residues and Naphtha)
- 5.2 By Derivative/Application
- 5.2.1 Traditional Chemical
- 5.2.1.1 Formaldehyde
- 5.2.1.2 Acetic Acid
- 5.2.1.3 Solvent
- 5.2.1.4 Methylamine
- 5.2.1.5 Other Traditional Chemicals
- 5.2.2 Energy Related
- 5.2.2.1 Methanol-to-olefin (MTO)
- 5.2.2.2 Methyl Tert-butyl Ether (MTBE)
- 5.2.2.3 Gasoline Blending
- 5.2.2.4 Dimethyl Ether (DME)
- 5.2.2.5 Biodiesel
- 5.2.1 Traditional Chemical
- 5.3 By End-use Industry
- 5.3.1 Automotive and Transportation
- 5.3.2 Chemical
- 5.3.3 Marine Fuel
- 5.3.4 Others (Electronics and Appliances, power generation)
- 5.4 By Grade
- 5.4.1 Chemical Grade
- 5.4.2 Fuel Grade
- 5.4.3 Others (Ultra-Clean/Battery Grade and Renewable (Bio-/E-Methanol))
- 5.5 By Geography
- 5.5.1 Asia-Pacific
- 5.5.1.1 China
- 5.5.1.2 India
- 5.5.1.3 Japan
- 5.5.1.4 South Korea
- 5.5.1.5 Vietnam
- 5.5.1.6 Thailand
- 5.5.1.7 Indonesia
- 5.5.1.8 Malaysia
- 5.5.1.9 Australia
- 5.5.1.10 New Zealand
- 5.5.1.11 Rest of Asia-Pacific
- 5.5.2 North America
- 5.5.2.1 United States
- 5.5.2.2 Canada
- 5.5.2.3 Mexico
- 5.5.3 Europe
- 5.5.3.1 Germany
- 5.5.3.2 United Kingdom
- 5.5.3.3 Italy
- 5.5.3.4 France
- 5.5.3.5 Turkey
- 5.5.3.6 Russia
- 5.5.3.7 Nordics
- 5.5.3.8 Spain
- 5.5.3.9 Rest of Europe
- 5.5.4 South America
- 5.5.4.1 Brazil
- 5.5.4.2 Argentina
- 5.5.4.3 Colombia
- 5.5.4.4 Rest of South America
- 5.5.5 Middle East and Africa
- 5.5.5.1 Saudi Arabia
- 5.5.5.2 Qatar
- 5.5.5.3 United Arab Emirates
- 5.5.5.4 Iran
- 5.5.5.5 South Africa
- 5.5.5.6 Nigeria
- 5.5.5.7 Egypt
- 5.5.5.8 Rest of Middle East and Africa
- 5.5.1 Asia-Pacific
6 Competitive Landscape
- 6.1 Market Concentration
- 6.2 Strategic Moves
- 6.3 Market Share Analysis
- 6.4 Company Profiles (includes Global level Overview, Market level overview, Core Segments, Financials as available, Strategic Information, Market Rank/Share for key companies, Products and Services, and Recent Developments)
- 6.4.1 Atlantic Methanol
- 6.4.2 BASF SE
- 6.4.3 Carbon Recycling International (CRI)
- 6.4.4 Celanese Corporation
- 6.4.5 China National Chemical Corporation (ChemChina)
- 6.4.6 Coogee
- 6.4.7 Enerkem
- 6.4.8 Eni S.p.A.
- 6.4.9 Gujarat State Fertilizers & Chemicals Limited (GSFC)
- 6.4.10 INEOS
- 6.4.11 Kaveh Methanol Company
- 6.4.12 Kingboard Holdings Limited
- 6.4.13 LyondellBasell Industries Holdings B.V.
- 6.4.14 Methanex Corporation
- 6.4.15 MITSUBISHI GAS CHEMICAL COMPANY, INC
- 6.4.16 Natgasoline
- 6.4.17 Ningxia Baofeng Energy Group
- 6.4.18 OCI
- 6.4.19 Petroliam Nasional Berhad (PETRONAS)
- 6.4.20 Proman
- 6.4.21 SABIC
- 6.4.22 Yankuang Energy
- 6.4.23 ZPC Integrated Refining & Petrochemical (Zhejiang)
7 Market Opportunities and Future Outlook
- 7.1 Growing Trends Toward Renewable Methanol
- 7.2 White-space and Unmet-Need Assessment

