
PUBLISHER: Mordor Intelligence | PRODUCT CODE: 1851384

PUBLISHER: Mordor Intelligence | PRODUCT CODE: 1851384
Medical Robots - Market Share Analysis, Industry Trends & Statistics, Growth Forecasts (2025 - 2030)
The medical robots market size is estimated at USD 15.47 billion in 2025 and is forecast to advance to USD 32.67 billion by 2030, translating into a 16.13% CAGR that outpaces overall medical-device growth.
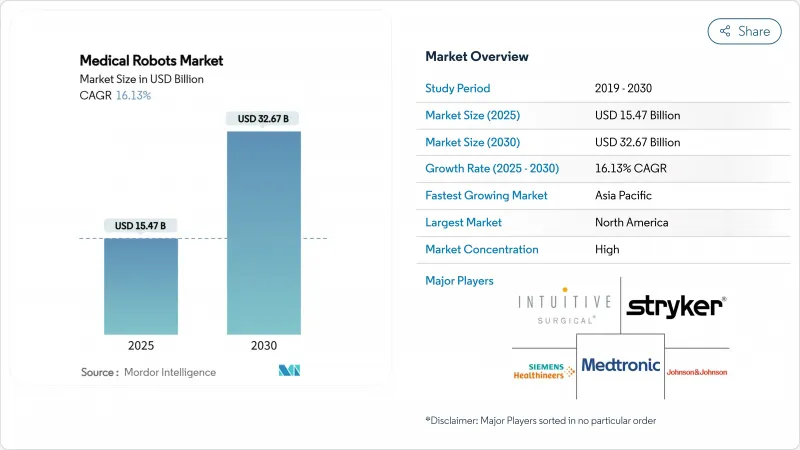
Growing convergence between artificial intelligence and precision engineering, subscription-based financing that removes capital barriers, and regulatory policies that favor automated solutions are key accelerants. Procedure volumes are rising fastest in outpatient surgery centers across the United States and Europe, while China's tier-3 hospitals deploy oncology-focused platforms to shorten cancer treatment queues. North America maintains leadership through favorable reimbursement, yet Asia-Pacific registers the steepest growth curve as government-sponsored rehabilitation programs expand access. Competitive positioning hinges on installed base, clinical evidence, and the ability to wrap hardware in data-driven service contracts that lock in recurring revenue.
Global Medical Robots Market Trends and Insights
Accelerating Adoption of Outpatient Robotic Surgery Centers in the United States & Europe
Ambulatory surgery facilities reduce procedure costs by 30-40% relative to inpatient settings while matching clinical outcomes, a differential that compels payers to steer appropriate cases into same-day pathways. Medicare's payment updates for 2025 continue to expand the ASC-eligible list, and private insurers deploy bundled payments that reward high-throughput centers. European systems follow suit; Germany links hospital funding to procedure-volume thresholds, prompting regional networks to pool robotic assets to keep complex cases local.
Rapid Surge in Oncology-Focused Robotic Procedures within China's Tier-3 Hospitals
China's National Health Commission increasingly references robot-assisted resection in its oncology protocols, spurring procurement among provincial referral centers that traditionally lacked capital budgets. Hospitals leverage robotics to recruit top surgeons from tier-1 cities and to standardize outcomes across sprawling networks. Domestic vendors enter with lower-priced systems, compressing acquisition costs and accelerating penetration beyond state targets.
Rising Back-log of Post-Warranty Service Costs Deterring Smaller Hospitals
Annual service contracts can reach 15% of the original purchase price, and out-of-warranty repairs often exceed USD 100,000, a financial hurdle that smaller sites struggle to budget. As first-generation systems installed in the mid-2010s age, maintenance peaks, forcing administrators to defer new purchases or limit utilization to funded cases.
Other drivers and restraints analyzed in the detailed report include:
- Mandatory Minimum-Volume Policies in Germany Pushing Hospitals toward Robotic Systems for Complex Surgeries
- Emergence of Subscription & Leasing Business Models Reducing Up-front CAPEX in Middle-Income Markets
- Data-Protection Regulations (GDPR/HIPAA) Limiting Cloud-Connected Robot Analytics
For complete list of drivers and restraints, kindly check the Table Of Contents.
Segment Analysis
Surgical systems retained a 26.9% share of the medical robots market size in 2024, buoyed by mature reimbursement codes and extensive surgeon training pipelines. Utilization spans urology, gynecology, general, and orthopedic procedures, with cumulative da Vinci case volumes surpassing 15 million globally. Oncology applications in radiosurgery, led by platforms such as CyberKnife, demonstrate 89.3% local tumor-control rates, reinforcing clinical acceptance.
Rehabilitative solutions trail in revenue but are scaling quickly on the back of publicly funded stroke programs. Exoskeleton sessions deliver higher therapy intensity, and early health-economic studies show 15% faster functional recovery versus conventional physiotherapy. Combined, these factors push rehabilitation robotics to an 18.2% CAGR, the fastest within the medical robots market.
Instruments and accessories represented 51% of the medical robots market share in 2024, reflecting the razor-razor blade economics of consumables. Each multi-port procedure consumes USD 800-USD 1,600 in disposable instruments, creating predictable income streams for vendors. Meanwhile, the services line-covering software, analytics, training, and field maintenance-grows at 18.71% CAGR as hospitals pivot to subscription bundles that promise system uptime and periodic upgrades. Vendors regard services as margin-accretive, and investor presentations flag a target mix where recurring contracts exceed hardware sales by 2028 within the medical robots market.
Medical Robots Market Report is Segmented by Product Type (Surgical, Rehabilitative, and More), Component (Robotics Systems, Instruments, Services, Software), Application (General Surgery, Orthopedics, Neurosurgery, and More), Application(general Surgery, Orthopedic Surgery, and More), End User (Hospitals, Ascs, and More), Automation Level, and Geography. The Market Forecasts are Provided in Terms of Value (USD).
Geography Analysis
North America captured 36% revenue in 2024, supported by clear FDA pathways, strong venture funding, and payer acceptance of robotic codes. U.S. ambulatory centers increasingly integrate multi-specialty robotic suites, and Canada's provincial tenders shift toward leasing to manage upfront budgets. Mexico's private hospitals embrace robotics to service inbound medical tourists seeking cost-effective bariatric and orthopedic procedures.
Asia-Pacific is the fastest-growing geography at an 18% CAGR to 2030, underpinned by public funding, demographic pressure, and rising insured populations. China's tier-3 hospital procurements accelerate oncology robot volumes, while Japan subsidizes exoskeletons for post-stroke therapy under its national insurance scheme. India's corporate hospital chains adopt robots to differentiate care and draw diaspora patients, with procedural pricing 40-60% lower than Western counterparts.
Europe shows moderate but steady adoption shaped by heterogeneous payer systems. Germany's volume-based quality rules force robotic investment, especially in visceral and cardiac surgery. The United Kingdom's NICE incorporates cost-effectiveness thresholds, stretching adoption timelines yet ensuring sustainable utilization. France, Italy, and Spain pool robotic assets across regional clusters, while the Nordics integrate robotic data feeds into national registries for outcome benchmarking.
- Intuitive Surgical Inc.
- Stryker Corporation
- Medtronic plc
- Johnson and Johnson (Ethicon/Auris)
- Siemens Healthineers AG (incl. Corindus)
- CMR Surgical Ltd
- Smith and Nephew plc
- Zimmer Biomet Holdings Inc.
- Globus Medical Inc.
- Asensus Surgical Inc.
- Brainlab AG
- Think Surgical Inc.
- PROCEPT BioRobotics Corp.
- Vicarious Surgical Inc.
- Titan Medical Inc.
- Renishaw plc
- MicroPort MedBot
- Accuray Incorporated
- Omnicell Technologies Inc.
- Aethon Inc.
Additional Benefits:
- The market estimate (ME) sheet in Excel format
- 3 months of analyst support
TABLE OF CONTENTS
1 INTRODUCTION
- 1.1 Study Assumptions and Market Definition
- 1.2 Scope of the Study
2 RESEARCH METHODOLOGY
3 EXECUTIVE SUMMARY
4 MARKET LANDSCAPE
- 4.1 Market Overview
- 4.2 Market Drivers
- 4.2.1 Accelerating Adoption of Outpatient Robotic Surgery Centers in the United States and Europe
- 4.2.2 Rapid Surge in Oncology-Focused Robotic Procedures within China's Tier-3 Hospitals
- 4.2.3 Mandatory Minimum-Volume Policies in Germany Pushing Hospitals toward Robotic Systems for Complex Surgeries
- 4.2.4 Emergence of Subscription and Leasing Business Models Reducing Up-front CAPEX in Middle-Income Markets
- 4.2.5 Integration of AI-Powered Intra-operative Imaging Driving Precision Neurosurgery Adoption
- 4.2.6 Government-Sponsored Rehabilitation Robotics Programs Addressing Stroke Burden in Japan and South Korea
- 4.3 Market Restraints
- 4.3.1 Rising Back-log of Post-Warranty Service Costs Deterring Smaller Hospitals
- 4.3.2 Data-Protection Regulations (GDPR/HIPAA) Limiting Cloud-Connected Robot Analytics
- 4.3.3 Shortage of Certified Robotic Surgeons in Latin America Slowing Utilization Rates
- 4.3.4 Stringent FDA Cybersecurity Draft Guidance Elevating Compliance Costs for New Entrants
- 4.4 Value / Supply-Chain Analysis
- 4.5 Regulatory and Technological Outlook
- 4.6 Porter's Five Forces Analysis
- 4.6.1 Bargaining Power of Suppliers
- 4.6.2 Bargaining Power of Buyers
- 4.6.3 Threat of New Entrants
- 4.6.4 Threat of Substitutes
- 4.6.5 Intensity of Competitive Rivalry
5 MARKET SIZE AND GROWTH FORECASTS (VALUE)
- 5.1 By Product Type
- 5.1.1 Surgical Robotic Systems
- 5.1.2 Rehabilitative Robotic Systems
- 5.1.3 Non-invasive Radiosurgery Robots
- 5.1.4 Hospital and Pharmacy Automation Robots
- 5.1.5 Other Medical Robots
- 5.2 By Component
- 5.2.1 Robotic Systems
- 5.2.2 Instruments and Accessories
- 5.2.3 Services (Maintenance, Training, Subscription)
- 5.2.4 Software and AI Platforms
- 5.3 By Application
- 5.3.1 General Surgery
- 5.3.2 Orthopedic Surgery
- 5.3.3 Neurosurgery
- 5.3.4 Cardiovascular
- 5.3.5 Gynecology
- 5.3.6 Urology
- 5.3.7 Oncology
- 5.3.8 Laparoscopy and Thoracoscopy
- 5.3.9 Other Applications
- 5.4 By End User
- 5.4.1 Hospitals and Clinics
- 5.4.2 Ambulatory Surgery Centers
- 5.4.3 Rehabilitation Centers
- 5.4.4 Homecare Settings
- 5.5 By Automation Level
- 5.5.1 Tele-operated
- 5.5.2 Semi-autonomous
- 5.5.3 Autonomous
- 5.5.4 Assistive and Collaborative
- 5.6 By Geography
- 5.6.1 North America
- 5.6.1.1 United States
- 5.6.1.2 Canada
- 5.6.1.3 Mexico
- 5.6.2 Europe
- 5.6.2.1 United Kingdom
- 5.6.2.2 Germany
- 5.6.2.3 France
- 5.6.2.4 Italy
- 5.6.2.5 Rest of Europe
- 5.6.3 Asia-Pacific
- 5.6.3.1 China
- 5.6.3.2 Japan
- 5.6.3.3 India
- 5.6.3.4 South Korea
- 5.6.3.5 Rest of Asia
- 5.6.4 Middle East
- 5.6.4.1 Israel
- 5.6.4.2 Saudi Arabia
- 5.6.4.3 United Arab Emirates
- 5.6.4.4 Turkey
- 5.6.4.5 Rest of Middle East
- 5.6.5 Africa
- 5.6.5.1 South Africa
- 5.6.5.2 Egypt
- 5.6.5.3 Rest of Africa
- 5.6.6 South America
- 5.6.6.1 Brazil
- 5.6.6.2 Argentina
- 5.6.6.3 Rest of South America
- 5.6.1 North America
6 COMPETITIVE LANDSCAPE
- 6.1 Market Concentration
- 6.2 Strategic Moves (MandA, Partnerships, Funding)
- 6.3 Market Share Analysis
- 6.4 Company Profiles (includes Global level Overview, Market level overview, Core Segments, Financials as available, Strategic Information, Market Rank/Share for key companies, Products and Services, and Recent Developments)
- 6.4.1 Intuitive Surgical Inc.
- 6.4.2 Stryker Corporation
- 6.4.3 Medtronic plc
- 6.4.4 Johnson and Johnson (Ethicon/Auris)
- 6.4.5 Siemens Healthineers AG (incl. Corindus)
- 6.4.6 CMR Surgical Ltd
- 6.4.7 Smith and Nephew plc
- 6.4.8 Zimmer Biomet Holdings Inc.
- 6.4.9 Globus Medical Inc.
- 6.4.10 Asensus Surgical Inc.
- 6.4.11 Brainlab AG
- 6.4.12 Think Surgical Inc.
- 6.4.13 PROCEPT BioRobotics Corp.
- 6.4.14 Vicarious Surgical Inc.
- 6.4.15 Titan Medical Inc.
- 6.4.16 Renishaw plc
- 6.4.17 MicroPort MedBot
- 6.4.18 Accuray Incorporated
- 6.4.19 Omnicell Technologies Inc.
- 6.4.20 Aethon Inc.
7 MARKET OPPORTUNITIES AND FUTURE OUTLOOK
- 7.1 White-space and Unmet-Need Assessment

