
PUBLISHER: Mordor Intelligence | PRODUCT CODE: 1851400

PUBLISHER: Mordor Intelligence | PRODUCT CODE: 1851400
Vibration Monitoring - Market Share Analysis, Industry Trends & Statistics, Growth Forecasts (2025 - 2030)
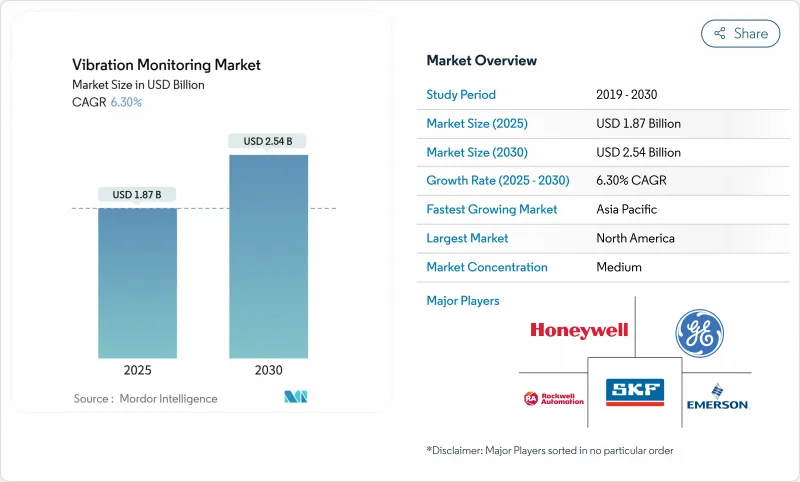
The vibration monitoring market is valued at USD 1.87 billion in 2025 and is projected to reach USD 2.54 billion by 2030, advancing at a 6.3% CAGR through the forecast period.
Increasing recognition of the high cost of unplanned machinery failures is shifting maintenance strategies from reactive to predictive approaches, driving steady investment in condition-based monitoring across oil and gas, power generation, and discrete manufacturing. Wireless IIoT sensors, edge analytics, and cloud platforms are converging to reduce data-collection costs, extend coverage to hard-to-reach assets, and enable prescriptive insights that lengthen asset life. Heightened regulatory pressure in hazardous industries, the retirement deferment of aging coal-fired plants, and government-backed smart-manufacturing schemes in Asia further accelerate demand. Competitive intensity is rising as established automation majors fold vibration analytics into broader digital-twin ecosystems, raising entry barriers for stand-alone sensor suppliers and strengthening the long-term growth outlook for the vibration monitoring market.
Global Vibration Monitoring Market Trends and Insights
Rising Adoption of Wireless IIoT-Enabled Sensors in Hazardous Zones
Wireless, intrinsically safe vibration sensors are replacing cabled solutions in refineries, chemical plants, and offshore rigs as operators seek to minimize human exposure and maintenance overheads. Emerson's AMS Wireless Vibration Monitor, which operates on WirelessHART and provides a three-to-five-year battery life, illustrates how modern devices now combine triaxial accelerometry with embedded prescriptive analytics, enabling remote coverage of pumps, compressors, and steam traps. Aramco's roll-out of 454 wireless vibration nodes at the Fadhili Gas Plant shows the scalability of these solutions in large-scale hazardous. Improved protocol security and edge processing continue to lower total cost of ownership, underpinning broader acceptance across the vibration monitoring market.
Shift from Periodic to Online Continuous Monitoring in Power-Generation Turbines
Power utilities are abandoning route-based checks in favor of permanent sensors that stream high-resolution data to remote centers staffed by rotating-equipment specialists. GE Vernova's Remote Monitoring & Diagnostics service connects thousands of steam- and gas-turbine data points to cloud analytics that spot anomalies one to two months before failure, allowing optimized shutdown scheduling. Combined-cycle plants benefit most, because rapid load changes introduce vibration patterns that legacy quarterly checks overlook. With original-equipment manufacturers now bundling performance guarantees to continuous-monitoring adherence, demand for always-on systems in the vibration monitoring market is set to climb steadily.
Scarcity of Vibration Analysts with ISO 18436-2 Certification
Modern systems generate large, complex data sets that still need expert interpretation to confirm machine faults. Training an analyst to ISO 18436-2 level takes two to three years, and supply lags industrial demand, especially in fast-growing economies. Many firms respond by outsourcing diagnostics or deploying automated analytics, yet intricate turbomachinery failures often require human judgement, tempering expansion in parts of the vibration monitoring market.
Other drivers and restraints analyzed in the detailed report include:
- Asset-Criticality-Based Predictive-Maintenance Mandates by Offshore Oil & Gas Operators
- Government-Funded Smart-Manufacturing Programs Boosting MEMS Accelerometer Demand
- Cyber-Hardening Costs for Cloud-Connected Monitoring Gateways
For complete list of drivers and restraints, kindly check the Table Of Contents.
Segment Analysis
Hardware led the vibration monitoring market with 62% revenue in 2024, underscoring the central role of accelerometers, velocity pickups, and proximity probes in every installation. Accelerometers dominate because they span wide frequency ranges and mount easily on pumps, motors, and gearboxes, while displacement transducers remain mandatory on high-speed turbines. The hardware share is expected to moderate as MEMS and optical sensors widen application scope and reduce node cost. Services, however, post the strongest 7.8% CAGR through 2030 as users shift toward outcome-based contracts that bundle data analytics, diagnostics, and maintenance recommendations. Software evolves in parallel, migrating from on-premise spectrum viewers to cloud platforms that apply machine learning and digital-twin correlation, enabling vendors to lock in recurring revenue. TDK's Tronics AXO 315, a digital, force-rebalance MEMS accelerometer, exemplifies how firmware-rich sensors blur the line between hardware and software services.
The growing emphasis on predictive insights positions service providers as strategic partners rather than transactional suppliers. Managed-service contracts that charge per monitored asset or per avoided downtime align incentives and amplify demand for analytics subscriptions. Large automation houses leverage global service networks to capture this value, while niche diagnostic firms specialize in complex failure modes. As labor shortages tighten, automated diagnostics gain favor, reinforcing service-led growth across the vibration monitoring market.
Online continuous monitoring captured 55% of 2024 revenue, a position it will hold as long as critical equipment such as turbines, compressors, and extruders require around-the-clock oversight. Continuous data streams allow trending of spectral signatures and early identification of transient events that route-based measurements miss. Portable systems still serve lower-criticality assets, yet cost reductions in wireless sensing are tilting budgets toward permanent nodes that combine vibration and temperature channels on a single device.
Wireless remote monitoring is forecast to rise at a 9.2% CAGR. Battery-powered nodes now sustain three-plus years of life, and industrial-grade mesh protocols provide deterministic latency suitable for protection logic. Emerson reports deployments of thousands of wireless vibration points per site, proving viable scale for large complexes. Edge-resident analytics further lower bandwidth needs by transmitting only pre-filtered indicators. As these advantages compound, the vibration monitoring market increasingly favors wireless architectures for both greenfield and retrofit projects.
The Vibration Monitoring Market Report is Segmented by Component (Hardware, Software, Services), Monitoring Process (Online/Continuous, Portable, Wireless Remote), Deployment Mode (On-Premises, Cloud), Network Technology (Wired, Wireless), Application (Motors and Pumps, Turbines, and More), End-User Industry (Oil and Gas, Energy, Automotive, and More), and Geography. The Market Forecasts are Provided in Terms of Value (USD).
Geography Analysis
North America led with 37% of 2024 revenue, propelled by offshore oil and gas regulations that mandate online condition monitoring, plus large-scale retrofits in the United States power sector. Utilities extending the life of coal-fired units and combined-cycle plants underpin continual sensor demand, while Canada's oil sands operations require robust devices that withstand extreme cold and dust. Government emphasis on workplace safety also promotes investment, cementing the region's dominance in the vibration monitoring market.
Europe maintains a sizeable share on the strength of its manufacturing base and energy-efficiency legislation. Germany champions Industry 4.0 roll-outs that couple vibration data with MES and ERP systems for holistic asset views. The United Kingdom's North Sea operators invest heavily in wireless mesh sensing to overcome hazardous-area cabling costs, while the EU's stringent machinery directives embed condition monitoring within risk-assessment frameworks. These factors create stable, compliance-driven demand that supports the vibration monitoring market across the continent.
Asia-Pacific posts the fastest 8.6% CAGR, buoyed by Chinese, Japanese, and Indian smart-manufacturing incentives that subsidize sensor adoption. Semiconductor strategies emphasizing local MEMS production further reduce device cost. Rapid industrialization across Southeast Asia and government efforts to digitalize SMEs expand the addressable base. Adoption of wireless protocols and cloud analytics is swift in new plants unencumbered by legacy systems, positioning the region as a key growth engine for the vibration monitoring market.
- SKF
- Emerson Electric Co.
- General Electric (Baker Hughes)
- Honeywell International Inc.
- Rockwell Automation Inc.
- National Instruments Corp.
- Analog Devices Inc.
- Siemens AG
- ABB Ltd.
- Fluke Corporation
- Bruel and Kjar Vibro
- Meggitt PLC
- SPM Instrument AB
- Schaeffler AG
- STMicroelectronics
- PCB Piezotronics Inc.
- Banner Engineering Corp.
- Parker Hannifin (Kinetics)
- Azima DLI Corporation
- Baker Hughes Condition Monitoring
Additional Benefits:
- The market estimate (ME) sheet in Excel format
- 3 months of analyst support
TABLE OF CONTENTS
1 INTRODUCTION
- 1.1 Study Assumptions and Market Definition
- 1.2 Scope of the Study
2 RESEARCH METHODOLOGY
3 EXECUTIVE SUMMARY
4 MARKET LANDSCAPE
- 4.1 Market Overview
- 4.2 Market Drivers
- 4.2.1 Rising Adoption of Wireless IIoT-Enabled Sensors in Hazardous Zones (Global)
- 4.2.2 Shift from Periodic to Online Continuous Monitoring in Power Generation Turbines (North America and Europe)
- 4.2.3 Asset-criticality-based Predictive Maintenance Mandates by Offshore Oil and Gas Operators (Middle East)
- 4.2.4 Government-funded Smart Manufacturing Programs Boosting MEMS Accelerometer Demand (Asia)
- 4.2.5 Aging Coal-Fired Plants Retrofitting Vibration Monitoring for Life-Extension (South America)
- 4.3 Market Restraints
- 4.3.1 Scarcity of Vibration Analysts with ISO 18436-2 Certification
- 4.3.2 Cyber-hardening Costs for Cloud-connected Monitoring Gateways
- 4.3.3 Low ROI Perception in Low-runtime Batch Food Processing Lines
- 4.3.4 Fragmented Wireless Standards Causing Interoperability Issues
- 4.4 Value / Supply-Chain Analysis
- 4.5 Regulatory Outlook
- 4.6 Technological Outlook
- 4.7 Porter's Five Forces Analysis
- 4.7.1 Bargaining Power of Suppliers
- 4.7.2 Bargaining Power of Buyers
- 4.7.3 Threat of New Entrants
- 4.7.4 Threat of Substitutes
- 4.7.5 Intensity of Competitive Rivalry
5 MARKET SIZE AND GROWTH FORECASTS (VALUE)
- 5.1 By Component
- 5.1.1 Hardware
- 5.1.1.1 Accelerometers
- 5.1.1.2 Velocity Sensors
- 5.1.1.3 Displacement/Proximity Probes
- 5.1.1.4 Other Hardware (MEMS, Piezo, Optical)
- 5.1.2 Software
- 5.1.3 Services
- 5.1.1 Hardware
- 5.2 By Monitoring Process
- 5.2.1 Online/Continuous
- 5.2.2 Portable/Route-based
- 5.2.3 Wireless Remote (Edge and Cloud)
- 5.3 By Deployment Mode
- 5.3.1 On-premises
- 5.3.2 Cloud / SaaS
- 5.4 By Network Technology
- 5.4.1 Wired (4-20 mA, Modbus, Ethernet)
- 5.4.2 Wireless (BLE, ISA100, 6LoWPAN)
- 5.5 By Application
- 5.5.1 Motors and Pumps
- 5.5.2 Turbines and Compressors
- 5.5.3 Gearboxes and Bearings
- 5.5.4 Fans and Blowers
- 5.6 By End-user Industry
- 5.6.1 Oil and Gas
- 5.6.2 Energy and Power
- 5.6.3 Automotive and Transportation
- 5.6.4 Chemicals and Petrochemicals
- 5.6.5 Mining and Metals
- 5.6.6 Food and Beverage
- 5.6.7 Aerospace and Defense
- 5.6.8 Pulp and Paper
- 5.6.9 Marine
- 5.6.10 Other Industries
- 5.7 By Geography
- 5.7.1 North America
- 5.7.1.1 United States
- 5.7.1.2 Canada
- 5.7.1.3 Mexico
- 5.7.2 Europe
- 5.7.2.1 United Kingdom
- 5.7.2.2 Germany
- 5.7.2.3 France
- 5.7.2.4 Italy
- 5.7.2.5 Rest of Europe
- 5.7.3 Asia-Pacific
- 5.7.3.1 China
- 5.7.3.2 Japan
- 5.7.3.3 India
- 5.7.3.4 South Korea
- 5.7.3.5 Rest of Asia-Pacific
- 5.7.4 Middle East
- 5.7.4.1 Israel
- 5.7.4.2 Saudi Arabia
- 5.7.4.3 United Arab Emirates
- 5.7.4.4 Turkey
- 5.7.4.5 Rest of Middle East
- 5.7.5 Africa
- 5.7.5.1 South Africa
- 5.7.5.2 Egypt
- 5.7.5.3 Rest of Africa
- 5.7.6 South America
- 5.7.6.1 Brazil
- 5.7.6.2 Argentina
- 5.7.6.3 Rest of South America
- 5.7.1 North America
6 COMPETITIVE LANDSCAPE
- 6.1 Market Concentration
- 6.2 Strategic Moves
- 6.3 Market Share Analysis
- 6.4 Company Profiles (includes Global level Overview, Market level overview, Core Segments, Financials as available, Strategic Information, Market Rank/Share for key companies, Products and Services, and Recent Developments)
- 6.4.1 SKF
- 6.4.2 Emerson Electric Co.
- 6.4.3 General Electric (Baker Hughes)
- 6.4.4 Honeywell International Inc.
- 6.4.5 Rockwell Automation Inc.
- 6.4.6 National Instruments Corp.
- 6.4.7 Analog Devices Inc.
- 6.4.8 Siemens AG
- 6.4.9 ABB Ltd.
- 6.4.10 Fluke Corporation
- 6.4.11 Bruel and Kjar Vibro
- 6.4.12 Meggitt PLC
- 6.4.13 SPM Instrument AB
- 6.4.14 Schaeffler AG
- 6.4.15 STMicroelectronics
- 6.4.16 PCB Piezotronics Inc.
- 6.4.17 Banner Engineering Corp.
- 6.4.18 Parker Hannifin (Kinetics)
- 6.4.19 Azima DLI Corporation
- 6.4.20 Baker Hughes Condition Monitoring
7 MARKET OPPORTUNITIES AND FUTURE OUTLOOK
- 7.1 White-space and Unmet-need Assessment

