
PUBLISHER: Mordor Intelligence | PRODUCT CODE: 1851484

PUBLISHER: Mordor Intelligence | PRODUCT CODE: 1851484
Security Analytics - Market Share Analysis, Industry Trends & Statistics, Growth Forecasts (2025 - 2030)
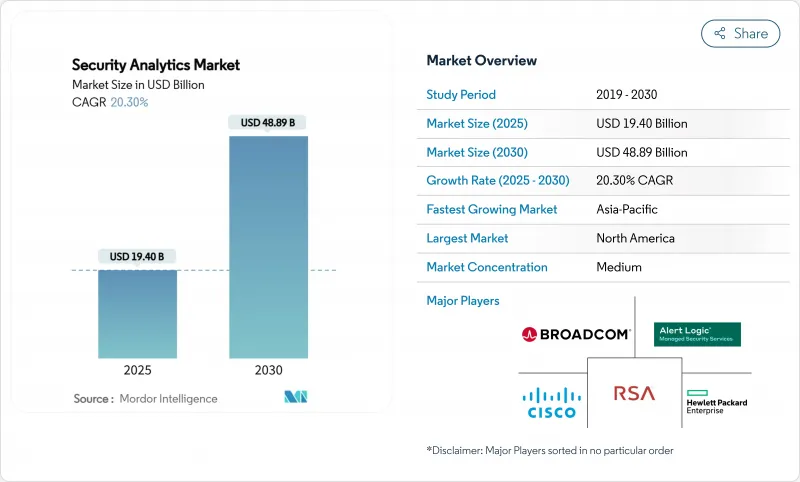
The security analytics market is valued at USD 19.40 billion in 2025 and is forecast to touch USD 48.89 billion by 2030, advancing at a CAGR of 20.30%.
The surge reflects enterprises' drive to neutralize sophisticated cyber-attacks with AI-led platforms that analyze billions of events in real time. Growth stems from an explosion of IoT endpoints, cloud-first transformation projects, and tightening compliance regimes that require automated analytics. Demand is further amplified by platform consolidation: large vendors now bundle SIEM, SOAR, UEBA, and threat-intelligence into single suites to simplify operations and counter tool sprawl. CrowdStrike, Palo Alto Networks, Microsoft, IBM, and Cisco compete aggressively on analytics breadth, speed, and native automation while niche specialists maintain traction through differentiated AI models and cloud-native architectures.
Global Security Analytics Market Trends and Insights
Sophistication of cyber-threat landscape
Nation-state actors now deploy automated toolchains that evade signature-based defenses, pushing enterprises toward behavioral analytics that detect lateral movement and zero-day exploits. The FBI cited a spike in state-sponsored attacks on telecom carriers aimed at surveillance and data exfiltration. Security teams therefore favor platforms with machine-learning models that self-learn network baselines and flag anomalous paths in milliseconds. Vendors integrate UEBA and threat-intel feeds directly into SIEM engines, shrinking dwell time and improving mean time to detect. This arms race rewards suppliers able to retrain models continuously without manual feature engineering.
Explosive growth of IoT and BYOD endpoints
Industrial sensors, medical devices, and remote-work laptops have swollen the attack surface, leaving perimeter controls ineffective. Research in Scientific Reports found that more than 60% of organizations suffered insider threats tied to unmanaged devices. Modern analytics ingest telemetry from OT gateways, mobile EDR agents, and edge nodes, applying unsupervised learning to classify device behaviors. Edge processing cuts latency and keeps operations running when connectivity drops. Vendors now embed lightweight agents in firmware and combine them with cloud-side graph analytics to correlate anomalies across fleets of millions of endpoints.
Data-integration and tool-sprawl challenges
Most enterprises juggle 25-50 security tools that emit disjointed log schemas, forcing custom parsers and delaying correlation. CSO Online reports that integration overhead drains analyst capacity and obscures cross-vector attacks. Buyers are replacing point solutions with converged analytics suites, yet fear of vendor lock-in slows rip-and-replace projects. As cloud migration compounds complexity, platforms must normalize on-prem Syslog, cloud API metadata, and SaaS audit trails within a single data lake, or risk perpetuating silos.
Other drivers and restraints analyzed in the detailed report include:
- Cloud-first digital-transformation programs
- Expanding global cybersecurity-compliance regimes
- Global shortage of SOC analysts
For complete list of drivers and restraints, kindly check the Table Of Contents.
Segment Analysis
Network security analytics generated 38% of 2024 revenue, underscoring the enduring role of deep-packet inspection and NetFlow analysis in the security analytics market. Cloud security analytics is advancing at 17.6% CAGR to 2030 as enterprises shift workloads off-premises and seek cross-cloud visibility. Application, web, and endpoint analytics together broaden detection coverage, while insider-threat modules employ UEBA to profile user behavior.
The convergence of these sub-segments pushes vendors to embed microservices-based collectors that ingest diverse telemetry into unified data fabrics. Platforms offering AI-driven policy recommendations and automated remediation now achieve a 59% drop in false positives versus legacy rule engines. Integrated suites therefore appeal to security leaders aiming to slash alert noise while protecting network, application, and identity layers in one console.
On-premise implementations held 54.5% revenue in 2024, reflecting sunk investments and sovereign-data rules that keep sensitive logs inside firewalls. Yet the security analytics market size for cloud deployments is forecast to expand at a 21% CAGR through 2030 as firms adopt SASE and zero-trust mandates. Hybrid models are emerging as a pragmatic bridge-critical logs remain local while burst analysis occurs in secure clouds.
The U.S. Department of Defense's Zero Trust Architecture 2.0 targets full coverage by 2027, leaning on commercial cloud analytics for scalability. Consumption-based licensing and managed ingestion pipelines erase capital expenditure hurdles, enticing even regulated industries to offload compute-intensive correlation tasks. Vendors also deploy regional cloud "cells" to meet data-residency directives without sacrificing analytic depth.
The Security Analytics Market Report is Segmented by Application (Network Security Analytics, Application Security Analytics, and More), Deployment Mode (On-Premise, Cloud, Hybrid), Organization Size (Large Enterprises, Small and Medium Enterprises), End-User Industry (Banking and Financial Services, Healthcare, and More), and Geography. The Market Forecasts are Provided in Terms of Value (USD).
Geography Analysis
North America commanded 42% revenue in 2024, benefitting from sizable cyber-budgets and early uptake of AI-enhanced SIEM. Federal directives such as Executive Order 14028 force continuous diagnostics and disclosure, further fueling spend.
Asia-Pacific is projected to grow at 13.8% CAGR, propelled by cloud migrations, cyber-insurance penetration jumps, and government-backed digital programs. Gallagher Re reports Asia-Pacific cyber-insurance premiums climbing nearly 50% annually. Australia, Singapore, Japan, and South Korea spearhead spending, yet India and China add the largest volume of new deployments as domestic tech champions scale globally.
Latin America eyes 64% IT-budget expansion for 2025, prioritizing analytics that handle a region-wide average of 1,600 attacks per second. EMEA growth remains steady; Europe leans on GDPR and the forthcoming Cyber Resilience Act, while Middle East and North Africa security outlays are set to exceed USD 3 billion in 2025, spurred by AI adoption in oil, gas, and government sectors.
- Alert Logic, Inc.
- Arbor Networks, Inc. (NETSCOUT Systems, Inc.)
- Broadcom Inc. (Symantec Enterprise Division)
- Cisco Systems, Inc.
- RSA Security LLC
- Hewlett Packard Enterprise Company
- International Business Machines Corporation
- LogRhythm, Inc.
- Mandiant, Inc.
- Splunk Inc.
- Fortinet, Inc.
- McAfee, LLC
- Micro Focus International plc
- Securonix, Inc.
- Exabeam, Inc.
- Devo Technology, Inc.
- Microsoft Corporation
- Palo Alto Networks, Inc.
- CrowdStrike Holdings, Inc.
- Elastic N.V.
Additional Benefits:
- The market estimate (ME) sheet in Excel format
- 3 months of analyst support
TABLE OF CONTENTS
1 INTRODUCTION
- 1.1 Study Assumptions and Market Definition
- 1.2 Scope of the Study
2 RESEARCH METHODOLOGY
3 EXECUTIVE SUMMARY
4 MARKET LANDSCAPE
- 4.1 Market Overview
- 4.2 Market Drivers
- 4.2.1 Sophistication of cyber-threat landscape
- 4.2.2 Explosive growth of IoT and BYOD endpoints
- 4.2.3 Cloud-first digital-transformation programs
- 4.2.4 Expanding global cybersecurity-compliance regimes
- 4.2.5 AI-driven polymorphic malware emergence
- 4.2.6 Surge in unmanaged machine-to-machine identities
- 4.3 Market Restraints
- 4.3.1 Data-integration and tool-sprawl challenges
- 4.3.2 Global shortage of SOC analysts
- 4.3.3 High alert-fatigue and false-positive rates
- 4.3.4 Data-sovereignty rules restricting analytics
- 4.4 Value / Supply-Chain Analysis
- 4.5 Regulatory Landscape
- 4.6 Technological Outlook
- 4.7 Porter?s Five Forces
- 4.7.1 Threat of New Entrants
- 4.7.2 Bargaining Power of Buyers/Consumers
- 4.7.3 Bargaining Power of Suppliers
- 4.7.4 Threat of Substitute Products
- 4.7.5 Intensity of Competitive Rivalry
5 MARKET SIZE AND GROWTH FORECASTS
- 5.1 By Application
- 5.1.1 Network Security Analytics
- 5.1.2 Application Security Analytics
- 5.1.3 Web Security Analytics
- 5.1.4 Endpoint Security Analytics
- 5.1.5 Cloud Security Analytics
- 5.1.6 Insider Threat Analytics
- 5.2 By Deployment Mode
- 5.2.1 On-Premise
- 5.2.2 Cloud
- 5.2.3 Hybrid
- 5.3 By Organization Size
- 5.3.1 Large Enterprises
- 5.3.2 Small and Medium Enterprises
- 5.4 By End-user Industry
- 5.4.1 Banking and Financial Services
- 5.4.2 Healthcare
- 5.4.3 Defense and Security
- 5.4.4 Telecom and IT
- 5.4.5 Retail and E-Commerce
- 5.4.6 Manufacturing
- 5.4.7 Government
- 5.5 By Geography
- 5.5.1 North America
- 5.5.1.1 United States
- 5.5.1.2 Canada
- 5.5.1.3 Mexico
- 5.5.2 Europe
- 5.5.2.1 United Kingdom
- 5.5.2.2 Germany
- 5.5.2.3 France
- 5.5.2.4 Italy
- 5.5.2.5 Spain
- 5.5.2.6 Russia
- 5.5.2.7 Rest of Europe
- 5.5.3 Asia-Pacific
- 5.5.3.1 China
- 5.5.3.2 India
- 5.5.3.3 Japan
- 5.5.3.4 South Korea
- 5.5.3.5 Australia
- 5.5.3.6 Rest of Asia-Pacific
- 5.5.4 South America
- 5.5.4.1 Brazil
- 5.5.4.2 Argentina
- 5.5.4.3 Rest of South America
- 5.5.5 Middle East and Africa
- 5.5.5.1 Middle East
- 5.5.5.1.1 Saudi Arabia
- 5.5.5.1.2 United Arab Emirates
- 5.5.5.1.3 Turkey
- 5.5.5.1.4 Rest of Middle East
- 5.5.5.2 Africa
- 5.5.5.2.1 South Africa
- 5.5.5.2.2 Nigeria
- 5.5.5.2.3 Rest of Africa
- 5.5.1 North America
6 COMPETITIVE LANDSCAPE
- 6.1 Market Concentration
- 6.2 Strategic Moves
- 6.3 Market Share Analysis
- 6.4 Company Profiles (includes Global level Overview, Market level overview, Core Segments, Financials as available, Strategic Information, Market Rank/Share for key companies, Products and Services, and Recent Developments)
- 6.4.1 Alert Logic, Inc.
- 6.4.2 Arbor Networks, Inc. (NETSCOUT Systems, Inc.)
- 6.4.3 Broadcom Inc. (Symantec Enterprise Division)
- 6.4.4 Cisco Systems, Inc.
- 6.4.5 RSA Security LLC
- 6.4.6 Hewlett Packard Enterprise Company
- 6.4.7 International Business Machines Corporation
- 6.4.8 LogRhythm, Inc.
- 6.4.9 Mandiant, Inc.
- 6.4.10 Splunk Inc.
- 6.4.11 Fortinet, Inc.
- 6.4.12 McAfee, LLC
- 6.4.13 Micro Focus International plc
- 6.4.14 Securonix, Inc.
- 6.4.15 Exabeam, Inc.
- 6.4.16 Devo Technology, Inc.
- 6.4.17 Microsoft Corporation
- 6.4.18 Palo Alto Networks, Inc.
- 6.4.19 CrowdStrike Holdings, Inc.
- 6.4.20 Elastic N.V.
7 MARKET OPPORTUNITIES AND FUTURE OUTLOOK
- 7.1 White-space and Unmet-need Assessment

