
PUBLISHER: Mordor Intelligence | PRODUCT CODE: 1851615

PUBLISHER: Mordor Intelligence | PRODUCT CODE: 1851615
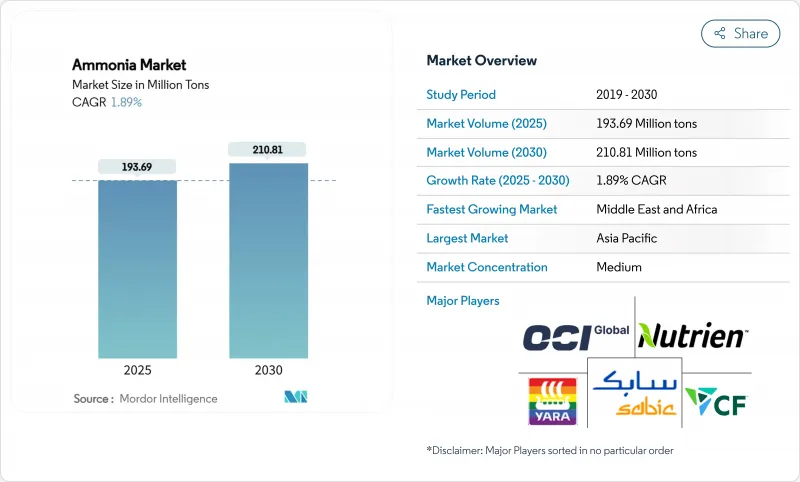
Ammonia - Market Share Analysis, Industry Trends & Statistics, Growth Forecasts (2025 - 2030)
The Ammonia Market size is estimated at 193.69 Million tons in 2025, and is expected to reach 210.81 Million tons by 2030, at a CAGR of 1.89% during the forecast period (2025-2030).
This steady topline belies a fundamental transition in production technologies, feedstock strategies, and downstream uses as decarbonization targets tighten, natural-gas price volatility persists, and low-carbon maritime fuels gain traction. Strategic investments in green and blue facilities, coal-to-gas upgrades in China, and the emergence of ammonia as a hydrogen carrier are repositioning supply chains, while rising safety requirements and urea oversupply keep short-term prices volatile. Producers able to lock in low-carbon feedstocks, secure renewable power, and form technology alliances are improving cost competitiveness, whereas Europe's gas-exposed assets remain under margin pressure. As these structural forces reshape the ammonia market, regional growth rates, product mixes, and trade flows are diverging more sharply than headline tonnage suggests.
Global Ammonia Market Trends and Insights
Surge in Low-Carbon Fertiliser Demand across Asia
Asia's agricultural pivot toward sustainability is accelerating low-carbon fertilizer uptake. China is upgrading coal-based assets with renewable electricity and carbon-capture systems, lifting demand for renewable ammonia blends. Indonesia's GAIA project introduces the first hybrid plant that co-feeds natural gas and electrolytic hydrogen, providing a scalable template for transition facilities. Policy incentives, such as preferential loan programs for sustainable inputs and tighter emission limits on conventional urea plants, are nudging farmers to premium products. The ripple effect is already evident in equipment orders for modular electrolysers and in long-term offtake contracts between fertilizer distributors and renewable electricity developers.
Adoption as Hydrogen Carrier for Maritime Bunkering
The maritime sector's decarbonization pledge is positioning ammonia as a practical hydrogen vector. Japan and South Korea completed the world's first truck-to-ship bunkering operation in 2024, demonstrating end-to-end handling safety and reinforcing confidence among port authorities. The International Maritime Organization's target to halve shipping emissions by 2050 has motivated carriers to lock in green ammonia supply agreements. Class-society approvals for ammonia-ready engines and the rollout of coastal carrier designs are lowering technical risk, while carbon-price forecasts improve project economics.
Volatile Natural-Gas Prices Inflating European Production Costs
European producers face chronic cost inflation as natural-gas spot prices remain above pre-2022 levels. Several plants operated by CF Industries and BASF have curtailed output, removing up to 7 million tons of effective capacity. Imports of Russian urea are back-filling the gap, complicating regional policy goals. Unless energy-sourcing contracts lock in competitive prices or blue-ammonia retrofits proceed swiftly, European supply is expected to lag global demand.
Other drivers and restraints analyzed in the detailed report include:
- Coal-to-Gas Conversion of Chinese Urea Plants
- Increasing Usage to Produce Explosives
- Safety & Toxicity Concerns
For complete list of drivers and restraints, kindly check the Table Of Contents.
Segment Analysis
Liquid product accounted for 95% of the ammonia market tonnage in 2024. This form benefits from higher volumetric energy density than compressed hydrogen, facilitating cost-effective storage for maritime bunker suppliers and long-distance pipeline blends. The segment is forecast to grow at 1.94% annually, slightly faster than the overall ammonia market, as new port bunkering hubs, on-site refrigeration systems, and specialized coastal carriers come online. Technological advances, including Japan's large-coastal-carrier prototypes, support larger parcel sizes that reduce delivered cost per ton. Investments in cryogenic insulation and detection systems mitigate boil-off losses, further reinforcing liquidity advantages.
The gaseous segment remains essential for processes requiring immediate gasification, such as certain polymer or caprolactam syntheses, yet its share is constrained by higher handling costs. Safety regulations limit transport pressures and demand thicker-walled cylinders, which inflates logistics expenses relative to refrigerated-liquid shipping. Although incremental growth is expected in niche petrochemical processes, liquid product will continue to dominate the ammonia market through 2030.
The Ammonia Market Report Segments the Industry by Type (Liquid and Gas), Application (Nitrogen Fertiliser Intermediate, Refrigerants (Industrial and Cold-Chain), Explosives and Mining Nitrates, and More), End-User Industry (Agriculture, Textiles, Mining, and More), and Geography (Asia-Pacific, North America, Europe, South America, and Middle East and Africa). The Market Forecasts are Provided in Terms of Volume (tons).
Geography Analysis
Asia-Pacific dominated the ammonia market with 51.40% share in 2024. China's coal-to-gas revamps and India's 750-ton-per-day Hygenco project expand low-carbon capacity, while Japanese and South Korean ports pioneer bunkering pilots. Regional policy packages offering renewable-power wheeling and tax rebates further lower delivered costs. Indonesia's hybrid plant in Aceh showcases transition pathways suited to resource-rich, power-constrained locations.
The Middle East and Africa region is the fastest-growing geography with a 2.67% CAGR projected for 2025-2030. Egypt's USD 33 billion deal pipeline, Morocco's billion-dollar Dakhla project, and Qatar's USD 1.2 billion brownfield expansion illustrate sovereign ambitions to monetize solar and wind resources through green or blue ammonia exports. Gulf Coast engineering firms and shipyard alliances provide technical expertise, accelerating construction timelines.
North America leverages abundant shale gas and carbon-capture hubs to keep marginal production costs low. CF Industries' 10.4 million-ton capacity and 37 US project proposals could raise regional output from 21 million to 79 million tons annually if sanctioned. Federal clean-hydrogen tax credits improve economics for blue facilities, and Gulf Coast ports offer deep-water access to European and Asian markets.
Europe wrestles with high gas prices and uncertain carbon-border tariffs. Production curtailments continue as spot prices remain volatile, though technology providers are accelerating blue-ammonia retrofits with up to 99% CO2 capture rates. Import dependence is rising, highlighted by increasing Russian urea inflows. Although the European Union seeks to promote domestic energy security, capital allocation favors downstream clean-fuel offtake agreements more than new indigenous capacity.
Latin America and Oceania add incremental growth through mining and bunker-fuel demand. Brazil's Port of Acu reserves land for a 1 million-ton green-ammonia facility, while Australia's iron-ore expansion drives explosives consumption.
- Acron PJSC
- BASF SE
- CF Industries Holdings Inc.
- CSBP
- Dyno Nobel
- EuroChem Group
- Group DF (Ostchem)
- Grupa Azoty
- IFFCO
- Industries Qatar
- JSC Togliattiazot
- Koch Fertilizer, LLC.
- LSB Industries
- Nutrien
- OCI
- Orica Limited
- PT Pupuk Sriwidjaja Palembang (Pusri)
- Rashtriya Chemicals and Fertilizers Limited
- SABIC
- Yara
Additional Benefits:
- The market estimate (ME) sheet in Excel format
- 3 months of analyst support
TABLE OF CONTENTS
1 Introduction
- 1.1 Study Assumptions and Market Definition
- 1.2 Scope of the Study
2 Research Methodology
3 Executive Summary
4 Market Landscape
- 4.1 Market Overview
- 4.2 Market Drivers
- 4.2.1 Surge in Low-Carbon Fertiliser Demand across Asia
- 4.2.2 Ammonia Adoption as Hydrogen Carrier for Maritime Bunkering in Japan and South Korea
- 4.2.3 Coal-to-Gas Conversion of Chinese Urea Plants Boosting Ammonia Off-take
- 4.2.4 Increasing Usage to Produce Explosives
- 4.2.5 Rising Demand for Green Ammonia
- 4.3 Market Restraints
- 4.3.1 Volatile Natural-Gas Prices Inflating European Production Costs
- 4.3.2 Safety and Toxicity Concerns Slowing its usage across various industries
- 4.3.3 Urea Over-supply Suppressing Spot Ammonia Demand
- 4.4 Value Chain Analysis
- 4.5 Technological Outlook
- 4.6 Porter's Five Forces
- 4.6.1 Bargaining Power of Suppliers
- 4.6.2 Bargaining Power of Buyers
- 4.6.3 Threat of New Entrants
- 4.6.4 Threat of Substitute Products and Services
- 4.6.5 Degree of Competition
5 Market Size and Growth Forecasts (Volume)
- 5.1 By Type
- 5.1.1 Liquid
- 5.1.2 Gas
- 5.2 By Application
- 5.2.1 Nitrogen Fertiliser Intermediate
- 5.2.2 Refrigerants (Industrial and Cold-Chain)
- 5.2.3 Explosives and Mining Nitrates
- 5.2.4 Pharmaceutical Intermediates
- 5.2.5 Others (Cleaning and Household Products and Marine Bunker Fuel / Hydrogen Carrier)
- 5.3 By End-use Industry
- 5.3.1 Agriculture
- 5.3.2 Textiles
- 5.3.3 Mining
- 5.3.4 Pharmaceutical
- 5.3.5 Referigeration
- 5.3.6 Others (Food and Beverage, Rubber, Water Treatment, Petroleum, and Pulp and Paper Industries)
- 5.4 By Geography
- 5.4.1 Asia-Pacific
- 5.4.1.1 China
- 5.4.1.2 India
- 5.4.1.3 Japan
- 5.4.1.4 South Korea
- 5.4.1.5 ASEAN
- 5.4.1.6 Australia
- 5.4.1.7 New Zealand
- 5.4.1.8 Rest of Asia-Pacific
- 5.4.2 North America
- 5.4.2.1 United States
- 5.4.2.2 Canada
- 5.4.2.3 Mexico
- 5.4.3 Europe
- 5.4.3.1 Germany
- 5.4.3.2 United Kingdom
- 5.4.3.3 France
- 5.4.3.4 Italy
- 5.4.3.5 Spain
- 5.4.3.6 Nordics
- 5.4.3.7 Rest of Europe
- 5.4.4 South America
- 5.4.4.1 Brazil
- 5.4.4.2 Argentina
- 5.4.4.3 Rest of South America
- 5.4.5 Middle East and Africa
- 5.4.5.1 Saudi Arabia
- 5.4.5.2 United Arab Emirates
- 5.4.5.3 Qatar
- 5.4.5.4 Turkey
- 5.4.5.5 South Africa
- 5.4.5.6 Egypt
- 5.4.5.7 Nigeria
- 5.4.5.8 Rest of Middle East and Africa
- 5.4.1 Asia-Pacific
6 Competitive Landscape
- 6.1 Market Concentration
- 6.2 Strategic Moves
- 6.3 Market Share (%)/Ranking Analysis
- 6.4 Company Profiles (includes Global level Overview, Market level overview, Core Segments, Financials as available, Strategic Information, Market Rank/Share for key companies, Products and Services, and Recent Developments)
- 6.4.1 Acron PJSC
- 6.4.2 BASF SE
- 6.4.3 CF Industries Holdings Inc.
- 6.4.4 CSBP
- 6.4.5 Dyno Nobel
- 6.4.6 EuroChem Group
- 6.4.7 Group DF (Ostchem)
- 6.4.8 Grupa Azoty
- 6.4.9 IFFCO
- 6.4.10 Industries Qatar
- 6.4.11 JSC Togliattiazot
- 6.4.12 Koch Fertilizer, LLC.
- 6.4.13 LSB Industries
- 6.4.14 Nutrien
- 6.4.15 OCI
- 6.4.16 Orica Limited
- 6.4.17 PT Pupuk Sriwidjaja Palembang (Pusri)
- 6.4.18 Rashtriya Chemicals and Fertilizers Limited
- 6.4.19 SABIC
- 6.4.20 Yara
7 Market Opportunities and Future Outlook
- 7.1 Ammonia Refrigeration Retrofitting in Food Retail
- 7.2 Carbon Capture and Storage (CCS) Integration for Blue Ammonia
- 7.3 White-space and Unmet-need Assessment

