
PUBLISHER: Mordor Intelligence | PRODUCT CODE: 1851708

PUBLISHER: Mordor Intelligence | PRODUCT CODE: 1851708
Environmental Sensors - Market Share Analysis, Industry Trends & Statistics, Growth Forecasts (2025 - 2030)
The environmental sensors market was valued at USD 2.51 billion in 2025 and is forecast to grow at a 10.37% CAGR, reaching USD 4.11 billion by 2030.
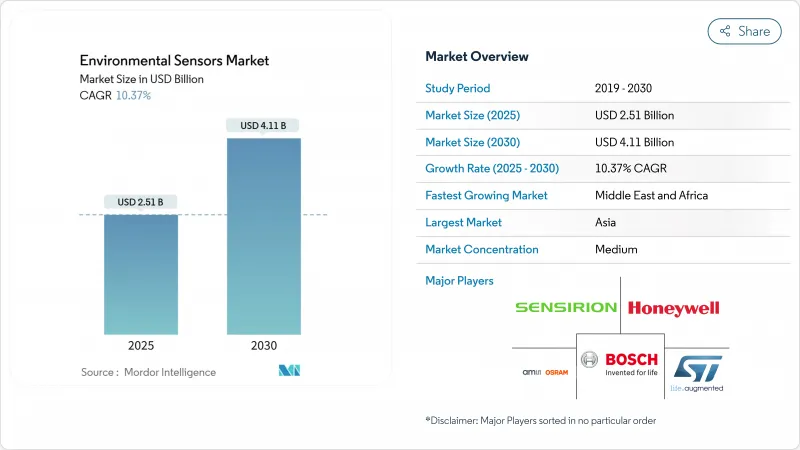
This robust outlook reflects intense regulatory pressure, rapid NB-IoT roll-outs, and widening adoption across smart cities, industrial IoT, and consumer wearables. Large accelerated filers in the United States must now disclose Scope 1 and Scope 2 greenhouse-gas emissions with third-party assurance, prompting accelerated sensor deployment for continuous monitoring. In Europe, the revised Ambient Air Quality Directive effective March 2025 forces member states to track ultrafine particles in real time, expanding demand for cost-effective sensor networks. Asia-Pacific leads the environmental sensors market thanks to Chinese NB-IoT infrastructure that supports high-density urban monitoring, while North America drives innovation in wildfire-detection networks and edge-AI platforms. Competitive intensity remains high as semiconductor majors, niche MEMS suppliers, and cloud-native IoT firms race to deliver resilient, cyber-secure, and self-calibrating solutions.
Global Environmental Sensors Market Trends and Insights
Increased NB-IoT Deployments Enabling Dense Urban Sensor Networks (Asia)
Chinese operators now run more than 900 million NB-IoT connections, and expansion plans aim for 1.9 billion by 2030, giving cities like Shenzhen the backbone for block-level air-quality mapping. The low-power wide-area standard supports decade-long battery life, deep-indoor penetration, and licensed-spectrum reliability, letting municipalities blanket high-rise districts without trenching cables. Neighboring economies from Thailand to the UAE mirror this model to accelerate smart-city roll-outs and ESG compliance.
Tightening EU Ambient Air-Quality Directive 2023/2119 Standards
The March 2025 directive slices the annual PM2.5 limit from 25 µg/m3 to 10 µg/m3 and mandates ultrafine particle tracking, forcing member states to supplement costly reference stations with dense sensor clusters. Real-time public-data access clauses privilege IoT-ready modules that stream measurements to central dashboards, spurring demand for calibrated MEMS units capable of +-5 µg/m3 accuracy in urban smog.
Calibration Drift & Maintenance Costs in Harsh Outdoor Environments
Electrochemical sensors deployed in outdoor environments experience significant calibration drift due to temperature fluctuations, humidity variations, and exposure to interfering gases, requiring recalibration intervals as frequent as every 3 months to maintain acceptable accuracy. This maintenance burden creates substantial operational costs that can exceed initial sensor procurement costs within the first year of deployment, particularly in harsh climates where environmental stressors accelerate sensor degradation. Research indicates that over 90% of sensors remain within calibration specifications during routine checks, suggesting that current maintenance schedules are overly conservative but necessary due to the high cost of compliance failures.
Other drivers and restraints analyzed in the detailed report include:
- ESG-Linked Industrial Emissions Disclosure Mandates (SEC, CSRD)
- Adoption of Multi-parameter Sensor Modules in Wearables & Hearables
- Limited Reference-Grade Calibration Infrastructure in Emerging Economies
For complete list of drivers and restraints, kindly check the Table Of Contents.
Segment Analysis
Fixed installations dominated the environmental sensors market size with 62% revenue in 2024, reflecting plant operators' need for uninterrupted proof of regulatory conformity. These wall-mounted or duct-inserted probes feed 24/7 data to environmental management systems that auditors rely on for Scope 1 verification. Portable devices, although smaller in volume, are pacing a 12.8% CAGR through 2030 as first-responders, mining firms, and construction consortia favor rapid deployment along shifting work sites. The Department of Homeland Security's wildfire pilot showed that trailer-mounted PM nodes delivered 30-minute lead times over satellite imagery, validating the business case for mobile grids.
Portables increasingly complement-not replace-fixed arrays. Utilities, for instance, install hard-wired SO2 stacks for compliance, then wheel battery-powered VOC sniffers during maintenance outages. Wearable units remain nascent but give consumer OEMs a route to health-centric differentiation, bundling pollen counts or pollution alerts into fitness dashboards. Over the forecast cycle, hybrid architectures blending permanent baselines with redeployable clusters will redefine procurement guidelines across the environmental sensors market.
Gas analyzers captured 26% of environmental sensors market share in 2024 thanks to mature electrochemical cells and NDIR optics that detect CO, NOx, and volatile organic compounds in factories, tunnels, and boilers. Particulate-matter devices, however, are charting a 13.5% CAGR as public-health agencies tighten PM2.5 exposure thresholds. Environmental sensors market size for PM instruments is forecast to reach USD 1.01 billion by 2030, buoyed by EU and California mandates demanding 10 µg/m3 annual averages.
Temperature, humidity, and pressure chips remain ubiquitous housekeeping parameters, often bundled with primary gas or PM functions inside multi-parameter modules. Bosch Sensortec's BME688 unites four physical sensors plus on-board AI inference, slicing bill-of-materials cost by 20% for OEMs that previously bought discrete components. Convergence blurs historical category lines, steering purchasing toward holistic "environment packs" rather than single-parameter parts.
The Environmental Sensors Market Report is Segmented by Product Type (Fixed, Portable, Wearable), Sensing Type (Gas, Temperature, Humidity, Pressure, Particulate Matter (PM), Multi-Parameter Modules), Connectivity (Wired, Wireless), End-User Industry (Industrial, Medical and Healthcare, Consumer Electronics, Automotive), and Geography. The Market Forecasts are Provided in Terms of Value (USD).
Geography Analysis
Asia-Pacific led the environmental sensors market with 38% revenue in 2024, powered by smart-city mega-projects in China and India that embed NB-IoT nodes in streetlights, buses, and schools. Shenzhen alone operates more than 37,000 air-quality boxes feeding open data portals. Strong electronics supply chains lower bill-of-materials, letting municipalities deploy square-kilometer grids for less than USD 15,000. Japanese and South Korean fabs inject advanced MEMS capacity, while Australian states invest in PM-and-smoke arrays for bushfire response.
North America ranks second by value. The environmental sensors market here gains momentum from SEC climate disclosure obligations and wildfire-defense funding across California, Oregon, and British Columbia. Cloud-edge alliances flourish: Honeywell's 2024 pact with Analog Devices links building-automation gateways directly to Azure IoT hubs, cutting integration times by half. Federal grants under the CHIPS and Science Act funnel R&D toward cyber-resilient sensor firmware.
Europe remains pivotal; tightened PM2.5 and ultrafine norms drive sensor retrofits across 400+ cities. Germany ties environmental telemetry to Industry 4.0 digital twins, while Nordic utilities install dew-point arrays inside district-heating vaults to manage condensation energy losses. Implementation lead times shorten because EU funds now reimburse up to 75% of air-quality network costs under Horizon Europe.
The Middle East and Africa presently represent a single-digit share but exhibit 14.2% CAGR. Gulf petro-states adopt continuous-leak detection for ESG-linked bond issuance, and South Africa's mining sector pilots low-cost PM nets to bolster labor-safety audits. Scarce calibration labs remain a hurdle, but donor-funded reference stations scheduled for 2026-2027 will unlock volume orders across Nairobi, Accra, and Lagos.
- ams OSRAM AG
- Sensirion Holding AG
- Bosch Sensortec GmbH
- Honeywell International Inc.
- Texas Instruments Inc.
- Analog Devices Inc.
- STMicroelectronics N.V.
- NXP Semiconductors N.V.
- TDK Corporation (InvenSense)
- Omron Corporation
- Sensata Technologies Inc.
- AlphaSense Inc.
- Figaro Engineering Inc.
- Banner Engineering Corp.
- Renesas Electronics Corp.
- Teledyne FLIR LLC
- Hanwei Electronics Group Corp.
- Powelectrics Ltd.
- Eurotech S.p.A.
- Omega Engineering Inc.
- Nesa Srl
- Eko Instruments B.V.
Additional Benefits:
- The market estimate (ME) sheet in Excel format
- 3 months of analyst support
TABLE OF CONTENTS
1 INTRODUCTION
- 1.1 Study Assumptions and Market Definition
- 1.2 Scope of the Study
2 RESEARCH METHODOLOGY
3 EXECUTIVE SUMMARY
4 MARKET LANDSCAPE
- 4.1 Market Overview
- 4.2 Market Drivers
- 4.2.1 Increased NB-IoT Deployments Enabling Dense Urban Sensor Networks (Asia)
- 4.2.2 Tightening EU Ambient Air-Quality Directive 2023/2119 Standards
- 4.2.3 ESG-Linked Industrial Emissions Disclosure Mandates (SEC, CSRD)
- 4.2.4 Adoption of Multi-parameter Sensor Modules in Wearables and Hearables
- 4.2.5 Green-Hydrogen and Battery Gigafactory Build-outs Requiring Humidity/Gas Sensors
- 4.2.6 Wild-fire Early-Warning Networks in North America Using Distributed PM Sensors
- 4.3 Market Restraints
- 4.3.1 Calibration Drift and Maintenance Costs in Harsh Outdoor Environments
- 4.3.2 Limited Reference-Grade Calibration Infrastructure in Emerging Economies
- 4.3.3 Cyber-security and IP Concerns Around Cloud-Connected Industrial Sensors
- 4.3.4 Price Erosion from Commoditization of MEMS Components
- 4.4 Value / Supply-Chain Analysis
- 4.5 Regulatory and Technological Outlook
- 4.6 Porter's Five Forces Analysis
- 4.6.1 Bargaining Power of Suppliers
- 4.6.2 Bargaining Power of Consumers
- 4.6.3 Threat of New Entrants
- 4.6.4 Threat of Substitute Products
- 4.6.5 Intensity of Competitive Rivalry
5 MARKET SIZE AND GROWTH FORECASTS (VALUE)
- 5.1 By Product Type
- 5.1.1 Fixed
- 5.1.2 Portable
- 5.1.3 Wearable
- 5.2 By Sensing Type
- 5.2.1 Gas
- 5.2.2 Temperature
- 5.2.3 Humidity
- 5.2.4 Pressure
- 5.2.5 Particulate Matter (PM)
- 5.2.6 Multi-parameter Modules
- 5.3 By Connectivity
- 5.3.1 Wired
- 5.3.2 Wireless
- 5.4 By End-User Industry
- 5.4.1 Industrial
- 5.4.2 Medical and Healthcare
- 5.4.3 Consumer Electronics
- 5.4.4 Automotive
- 5.4.5 Smart Homes and Buildings
- 5.4.6 Agriculture
- 5.4.7 Other End-Users
- 5.5 By Geography
- 5.5.1 North America
- 5.5.1.1 United States
- 5.5.1.2 Canada
- 5.5.1.3 Mexico
- 5.5.2 Europe
- 5.5.2.1 United Kingdom
- 5.5.2.2 Germany
- 5.5.2.3 France
- 5.5.2.4 Italy
- 5.5.2.5 Rest of Europe
- 5.5.3 Asia-Pacific
- 5.5.3.1 China
- 5.5.3.2 Japan
- 5.5.3.3 India
- 5.5.3.4 South Korea
- 5.5.3.5 Rest of Asia-Pacific
- 5.5.4 Middle East
- 5.5.4.1 Israel
- 5.5.4.2 Saudi Arabia
- 5.5.4.3 United Arab Emirates
- 5.5.4.4 Turkey
- 5.5.4.5 Rest of Middle East
- 5.5.5 Africa
- 5.5.5.1 South Africa
- 5.5.5.2 Egypt
- 5.5.5.3 Rest of Africa
- 5.5.6 South America
- 5.5.6.1 Brazil
- 5.5.6.2 Argentina
- 5.5.6.3 Rest of South America
- 5.5.1 North America
6 COMPETITIVE LANDSCAPE
- 6.1 Market Concentration
- 6.2 Strategic Moves
- 6.3 Market Share Analysis
- 6.4 Company Profiles (includes Global-level Overview, Market-level Overview, Core Segments, Financials as available, Strategic Information, Market Rank/Share, Products and Services, Recent Developments)
- 6.4.1 ams OSRAM AG
- 6.4.2 Sensirion Holding AG
- 6.4.3 Bosch Sensortec GmbH
- 6.4.4 Honeywell International Inc.
- 6.4.5 Texas Instruments Inc.
- 6.4.6 Analog Devices Inc.
- 6.4.7 STMicroelectronics N.V.
- 6.4.8 NXP Semiconductors N.V.
- 6.4.9 TDK Corporation (InvenSense)
- 6.4.10 Omron Corporation
- 6.4.11 Sensata Technologies Inc.
- 6.4.12 AlphaSense Inc.
- 6.4.13 Figaro Engineering Inc.
- 6.4.14 Banner Engineering Corp.
- 6.4.15 Renesas Electronics Corp.
- 6.4.16 Teledyne FLIR LLC
- 6.4.17 Hanwei Electronics Group Corp.
- 6.4.18 Powelectrics Ltd.
- 6.4.19 Eurotech S.p.A.
- 6.4.20 Omega Engineering Inc.
- 6.4.21 Nesa Srl
- 6.4.22 Eko Instruments B.V.
7 MARKET OPPORTUNITIES AND FUTURE OUTLOOK
- 7.1 White-space and Unmet-Need Assessment

