
PUBLISHER: Mordor Intelligence | PRODUCT CODE: 1851715

PUBLISHER: Mordor Intelligence | PRODUCT CODE: 1851715
Narcotics Scanner - Market Share Analysis, Industry Trends & Statistics, Growth Forecasts (2025 - 2030)
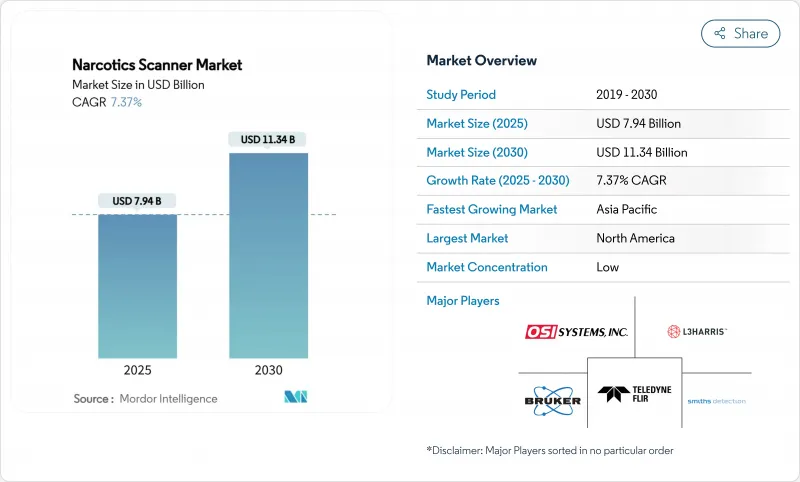
The narcotics scanner market size is valued at USD 7.94 billion in 2025 and is projected to reach USD 11.34 billion by 2030, expanding at a 7.37% CAGR.
Demand is propelled by regulatory mandates that require 100% container or baggage screening, surging postal shipments of synthetic opioids, and accelerated adoption of dual-energy trace detectors in airports. Government funding for counter-narco-terrorism programs and technology upgrades at land borders further sustains purchasing cycles. Competitive positioning hinges on modular platforms that merge spectroscopy, X-ray, and AI-driven analytics to curb false alarms while preserving throughput. Growth opportunities center on robotic and drone-mounted units that extend coverage to hazardous or large-area perimeters. Cost pressures tied to rare-earth inputs and high false-positive rates in legacy ion mobility devices remain key operational risks.
Global Narcotics Scanner Market Trends and Insights
Surge in synthetic opioid trafficking via postal and express freight routes
Postal channels moved record fentanyl volumes in 2024, forcing mail centers to deploy high-throughput scanners that marry X-ray computed tomography with spectroscopy for rapid triage. The STOP Act obliges international shippers to provide advance electronic data that feeds risk-scoring engines, allowing customs teams to route flagged parcels into automated inspection lanes. Lawrence Livermore patented physics-informed material disambiguation that improves threat recognition in CT images, cutting inspection cycle times while raising hit accuracy. Seizure intelligence shows traffickers using paraffin wax jars and mislabeled electronic parts, spurring multi-layer screening that blends chemical, biological, and explosive sensors under a single UI.
Rising airport adoption of dual-energy automated trace detection systems
The Transportation Security Administration funnels multiyear grants to refine 1064 nm Raman handhelds that read through packaging without fluorescence, slashing secondary screening queues. The Department of Homeland Security Screening at Speed program pilots millimeter-wave wands that discern metallic and organic threats in under three seconds. Japanese customs ordered next-generation portals from Smiths Detection, reinforcing a global pivot toward high-resolution dual-energy arrays that integrate AI image-analytics to suppress false alarms.
High False-Positive Rates of Ion Mobility Spectrometry Reducing User Confidence
Peer-reviewed studies show nanogram sensitivity for fentanyl but also highlight cross-reactivity with benign substances, which drives repeat alarms and erodes operator trust. NIST advocates tube redesigns using quartz to limit contamination and proposes workflow protocols that pair IMS with Raman for confirmation, halving investigative delays. Airports now insert machine-learning filters that compare ion mobility signatures against adaptive libraries, trimming error ratios without expensive hardware swaps.
Other drivers and restraints analyzed in the detailed report include:
- Regulatory mandates for 100% container scanning at major seaports
- Increasing use of contactless Raman handhelds by field law enforcement
- Data-privacy constraints limiting biometric-integrated scanner deployment in the EU
For complete list of drivers and restraints, kindly check the Table Of Contents.
Segment Analysis
Handheld units generated 46.0% of the narcotics scanner market in 2024 as patrol officers and customs agents prioritized portability for on-scene triage. Robotic and drone-mounted systems, while accounting for a smaller base, are set to advance at 8.35% CAGR, reflecting demand for remote inspection in hazardous or expansive areas. The narcotics scanner market size for handhelds is projected to widen steadily because new AI firmware pushes down detection time, improving mission productivity. Desktop analyzers continue to anchor laboratory workflows where chain-of-custody requirements demand comprehensive spectral confirmation. Meanwhile, container gantries integrate dual-energy imaging and neutron signatures, ensuring compliance with 100% scanning mandates in shipping lanes. Vendors position modular kits that let agencies migrate from handhelds to robotic mounts using the same detection core, driving lifecycle stickiness.
Operational constraints shape product strategy. Walk-through portals face installation limits inside older terminals, curbing new builds; however, retrofits that add multienergy sensors keep the installed base relevant. Drone payload capacity now supports miniaturized Raman devices, enabling aerial scanning of ship decks before boarding. Benchtop mass-spectrometry remains dominant in evidentiary labs, but field kits increasingly upload presumptive data directly to judicial databases, shortening case backlogs. This convergence supports a unified training doctrine, reducing agency onboarding costs and bolstering replacement demand, sustaining the narcotics scanner market through 2030.
Ion mobility spectrometry delivered 38.2% of 2024 revenue, underpinned by mature supply chains and operator familiarity. The narcotics scanner market share for IMS is forecast to erode gradually as terahertz systems post an 8.61% CAGR. Terahertz units map concealed objects with sub-millimeter resolution without direct contact, appealing to privacy-conscious venues because they avoid ionizing radiation. The narcotics scanner market size for terahertz platforms is expected to climb sharply once adaptation-YOLO algorithms, proven in 2025 trials, enter commercial release.
Raman spectroscopy rides momentum from handheld deployments; advancements at 1064 nm cut fluorescence, speeding scans through opaque plastics. Infrared and FT-IR keep specialized niches where molecular fingerprinting is mandated. Hybrid stacks that merge Raman and IMS inside a single chassis split scan duty by threat profile, mitigating false alarms. X-ray diffraction systems offer crystallographic insights for bulk powders, though high capital cost restrains uptake. Firms channel R&D toward software-defined detection that updates libraries over the air, ensuring responsiveness to novel psychoactive substances without hardware replacement.
The Narcotics Scanner Market Report is Segmented by Product Type (Desktop/Benchtop, Handheld/Portable, Walk-Through Portal, Vehicle/Container Scanners, Robotic and Drone-Mounted), Technology (Ion Mobility Spectrometry, Raman Spectroscopy, and More), Drug Type (Opioids, Cocaine, and More), End-User (Airports, Seaports, and More), and Geography. The Market Forecasts are Provided in Terms of Value (USD).
Geography Analysis
North America contributed 42.4% of global revenue in 2024 and remains the anchor region, fueled by federal mandates such as the STOP Act that enforce electronic data submission for inbound parcels and by DHS programs that subsidize advanced screening gear. Customs and Border Protection executes on-site lab pilots at major gateways, tightening the feedback loop between seizure intelligence and procurement. The narcotics scanner market size in the region benefits from multiyear budget allocations that secure vendor order backlogs through 2027.
Asia Pacific is projected to expand at 8.45% CAGR, the fastest worldwide. Governments allocate new funding to modernize border posts and port facilities, while law enforcement units acquire contactless Raman handhelds aimed at synthetic stimulants proliferation. Japan's USD 2.5 million support package for Uzbekistan's mobile teams exemplifies cross-border capacity building that drives regional volume. China's rare-earth dominance poses input risk; hence buyers pursue dual sourcing to hedge cost volatility, giving regional suppliers traction.
Europe shows steady replacement demand despite the privacy hurdles that slow biometric integration. Agencies invest in terahertz and neutron techniques to offset data-processing limits while aligning with the GDPR. South America scales container scanners to combat cocaine flow toward North Atlantic routes, leveraging bilateral aid for knowledge transfer. Middle East and Africa see incremental gains tied to counter-narco-terrorism funds that equip large seaports and critical infrastructure. Collectively, emerging economies prioritize modular solutions that can grow with fiscal cycles, ensuring long runway for the narcotics scanner market.
- OSI Systems Inc. (Rapiscan Systems)
- Smiths Detection Inc.
- FLIR Systems Inc. (Teledyne FLIR)
- Bruker Corporation
- L3Harris Technologies (Security and Detection)
- Nuctech Company Limited
- Viken Detection
- Thermo Fisher Scientific Inc.
- CEIA SpA
- DetectaChem LLC
- Astrophysics Inc.
- Chemring Group PLC
- QinetiQ Group PLC
- Leidos Holdings Inc.
- Teledyne Photon Machines
- Rigaku Corporation
- Safran SA (Morpho Detection legacy)
- Environics Oy
- Westminster Group PLC
- Rapisafe LLC
Additional Benefits:
- The market estimate (ME) sheet in Excel format
- 3 months of analyst support
TABLE OF CONTENTS
1 INTRODUCTION
- 1.1 Study Assumptions and Market Definition
- 1.2 Scope of the Study
2 RESEARCH METHODOLOGY
3 EXECUTIVE SUMMARY
4 MARKET LANDSCAPE
- 4.1 Market Overview
- 4.2 Market Drivers
- 4.2.1 Surge in Synthetic Opioid Trafficking via Postal and Express Freight Routes in North America and Europe
- 4.2.2 Rising Airport Adoption of Dual-Energy Automated Trace Detection Systems
- 4.2.3 Regulatory Mandates for 100 % Container Scanning at Major Seaports (e.g., US SAFE Port Act)
- 4.2.4 Increasing Use of Contactless Raman Handhelds by Field Law Enforcement in Asia
- 4.2.5 Growth of Dark-Web Parcel Deliveries Prompting Mail Center Screening Investments
- 4.2.6 Government Funding for Counter-Narco Terrorism Programs in Middle East and Africa
- 4.3 Market Restraints
- 4.3.1 High False-Positive Rates of Ion Mobility Spectrometry Reducing User Confidence
- 4.3.2 Data-Privacy Constraints Limiting Biometric-Integrated Scanner Deployment in EU
- 4.3.3 Budgetary Austerity in Small Airports and Caribbean Harbors
- 4.3.4 Supply-Chain Dependence on Rare-Earth Components Inflating Scanner Costs
- 4.4 Value / Supply-Chain Analysis
- 4.5 Regulatory Outlook
- 4.6 Porter's Five Forces Analysis
- 4.6.1 Threat of New Entrants
- 4.6.2 Bargaining Power of Buyers/Consumers
- 4.6.3 Bargaining Power of Suppliers
- 4.6.4 Threat of Substitute Products
- 4.6.5 Intensity of Competitive Rivalry
- 4.7 Industry Value Chain Analysis
- 4.8 Investment Analysis
5 MARKET SIZE AND GROWTH FORECASTS (VALUE)
- 5.1 By Product Type
- 5.1.1 Desktop / Benchtop
- 5.1.2 Handheld / Portable
- 5.1.3 Walk-Through Portal
- 5.1.4 Vehicle / Container Scanners
- 5.1.5 Robotic and Drone-Mounted Scanners
- 5.2 By Technology
- 5.2.1 Ion Mobility Spectrometry (IMS)
- 5.2.2 Raman Spectroscopy
- 5.2.3 Infrared (FT-IR and NIR) Spectroscopy
- 5.2.4 Mass Spectrometry
- 5.2.5 Terahertz Imaging
- 5.2.6 X-ray Diffraction (XRD)
- 5.2.7 Neutron Activation and Gamma-Ray
- 5.2.8 Hybrid and Multi-Modal Systems
- 5.3 By Drug Type Detected
- 5.3.1 Opioids (Heroin, Fentanyl and Analogues)
- 5.3.2 Cocaine and Crack
- 5.3.3 Methamphetamine and Amphetamines
- 5.3.4 Cannabis and THC Concentrates
- 5.3.5 Novel Psychoactive Substances (K2, Spice, etc.)
- 5.3.6 Others
- 5.4 By Deployment Site / End-user
- 5.4.1 Airports
- 5.4.2 Seaports and Container Terminals
- 5.4.3 Land Border Crossings
- 5.4.4 Law-Enforcement and Police Departments
- 5.4.5 Defense and Military Facilities
- 5.4.6 Postal and Courier Sorting Centers
- 5.4.7 Correctional Facilities and Prisons
- 5.4.8 Private Industry and Critical Infrastructure
- 5.5 By Geography
- 5.5.1 North America
- 5.5.1.1 United States
- 5.5.1.2 Canada
- 5.5.1.3 Mexico
- 5.5.2 South America
- 5.5.2.1 Brazil
- 5.5.2.2 Argentina
- 5.5.2.3 Colombia
- 5.5.2.4 Rest of South America
- 5.5.3 Europe
- 5.5.3.1 Germany
- 5.5.3.2 France
- 5.5.3.3 United Kingdom
- 5.5.3.4 Spain
- 5.5.3.5 Italy
- 5.5.3.6 Rest of Europe
- 5.5.4 Nordics
- 5.5.4.1 Sweden
- 5.5.4.2 Norway
- 5.5.4.3 Finland
- 5.5.4.4 Denmark
- 5.5.5 Asia-Pacific
- 5.5.5.1 China
- 5.5.5.2 India
- 5.5.5.3 Japan
- 5.5.5.4 South Korea
- 5.5.5.5 Southeast Asia
- 5.5.5.6 Australia
- 5.5.5.7 New Zealand
- 5.5.5.8 Rest of Asia-Pacific
- 5.5.6 Middle East and Africa
- 5.5.6.1 Middle East
- 5.5.6.1.1 Saudi Arabia
- 5.5.6.1.2 United Arab Emirates
- 5.5.6.1.3 Israel
- 5.5.6.1.4 Turkey
- 5.5.6.1.5 Rest of Middle East
- 5.5.6.2 Africa
- 5.5.6.2.1 South Africa
- 5.5.6.2.2 Nigeria
- 5.5.6.2.3 Kenya
- 5.5.6.2.4 Rest of Africa
- 5.5.1 North America
6 COMPETITIVE LANDSCAPE
- 6.1 Market Concentration
- 6.2 Strategic Moves
- 6.3 Market Share Analysis
- 6.4 Company Profiles (includes Global-Level Overview, Market-Level Overview, Core Segments, Financials, Strategic Information, Market Rank/Share, Products and Services, and Recent Developments)
- 6.4.1 OSI Systems Inc. (Rapiscan Systems)
- 6.4.2 Smiths Detection Inc.
- 6.4.3 FLIR Systems Inc. (Teledyne FLIR)
- 6.4.4 Bruker Corporation
- 6.4.5 L3Harris Technologies (Security and Detection)
- 6.4.6 Nuctech Company Limited
- 6.4.7 Viken Detection
- 6.4.8 Thermo Fisher Scientific Inc.
- 6.4.9 CEIA SpA
- 6.4.10 DetectaChem LLC
- 6.4.11 Astrophysics Inc.
- 6.4.12 Chemring Group PLC
- 6.4.13 QinetiQ Group PLC
- 6.4.14 Leidos Holdings Inc.
- 6.4.15 Teledyne Photon Machines
- 6.4.16 Rigaku Corporation
- 6.4.17 Safran SA (Morpho Detection legacy)
- 6.4.18 Environics Oy
- 6.4.19 Westminster Group PLC
- 6.4.20 Rapisafe LLC
7 MARKET OPPORTUNITIES AND FUTURE OUTLOOK
- 7.1 White-space and Unmet-Need Assessment

