
PUBLISHER: Mordor Intelligence | PRODUCT CODE: 1910558

PUBLISHER: Mordor Intelligence | PRODUCT CODE: 1910558
Insurtech - Market Share Analysis, Industry Trends & Statistics, Growth Forecasts (2026 - 2031)
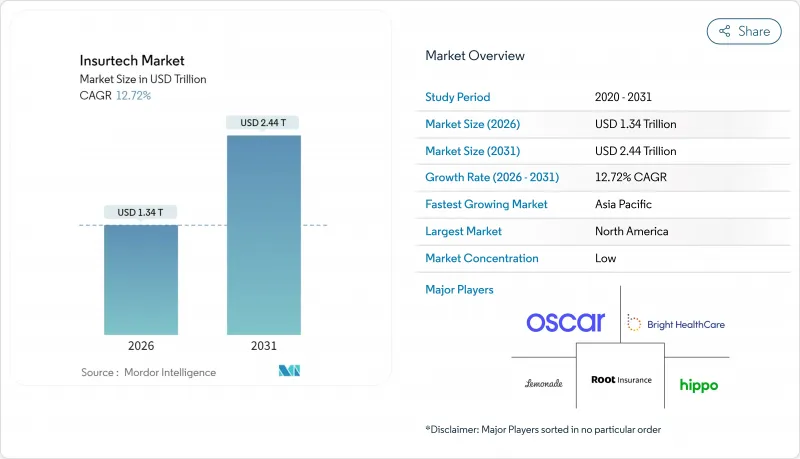
The insurtech market was valued at USD 1.19 trillion in 2025 and estimated to grow from USD 1.34 trillion in 2026 to reach USD 2.44 trillion by 2031, at a CAGR of 12.72% during the forecast period (2026-2031).
The sharp growth reflects a structural change in how insurers design, distribute, and service policies as digital-first experiences become table stakes. Cloud-native migrations, AI-enabled underwriting, and embedded insurance have shifted from pilot initiatives to enterprise standards, allowing carriers to cut operating costs, improve speed-to-market, and reach new customer segments. Government sandboxes in more than a dozen jurisdictions have accelerated solution rollouts, while strategic partnerships with mobility and IoT platforms are redefining risk assessment in auto and property lines. Competitive differentiation now rests on data access, platform agility, and the ability to embed coverage seamlessly into non-insurance purchase journeys, rather than on balance-sheet scale alone.
Global Insurtech Market Trends and Insights
Rising adoption of AI & ML for underwriting and claims
AI-driven decision engines now automate large portions of policy issuance and claims triage, shrinking average handling times and improving predictive accuracy. Swiss Re reported that shifting its claims analytics to Microsoft Azure enabled the majority of infrastructure automation, cutting assessment time in half. Insurers that master supervised learning on proprietary datasets gain defensible underwriting moats, pushing competitors to accelerate data-engineering roadmaps. The technology also unlocks new micro-duration products, such as usage-based mobility cover, because risk can be priced in real time. As regulators grow comfortable with explainable models, AI penetration is expected to rise fastest in personal auto, small commercial, and cyber lines. Vendor ecosystems offering pre-trained models on cloud marketplaces further lower adoption barriers.
Growing demand for personalized, on-demand insurance products
Consumers increasingly expect insurance to mimic e-commerce checkout flows, selecting coverage amounts and durations as easily as adding items to a cart. Allianz's partnership with Cosmo Connected embeds accident coverage in connected helmets for a fixed monthly fee, illustrating how IoT data can trigger automatic policy activation without paperwork . Parametric products are likewise filling gaps in travel, agriculture, and climate risk because they pay when predefined triggers hit, sidestepping lengthy claims adjustment. Marketplaces that bundle ancillary value-added services, such as health coaching or cyber monitoring, see higher renewal rates because propositions resonate with everyday needs. This shift forces carriers to re-platform legacy policy administration so riders and limits can adjust dynamically, moving away from static annual contracts.
Legacy core-system integration complexity
Decades-old mainframes often lack modern APIs, making real-time data exchange expensive and risky. Carriers, therefore, face a trade-off between wholesale replacement and piecemeal wrap-and-renew approaches. Failed conversions can stall policy issuance or claims payouts, eroding customer trust and drawing regulator scrutiny. Integration projects also carry hidden costs when data lineage and audit trails need preservation for compliance. As a result, some incumbents partner with greenfield entities instead of renovating core estates, slowing digital change within the mothership.
Other drivers and restraints analyzed in the detailed report include:
- Increasing migration to cloud-native core systems
- Regulatory sandboxes accelerating product launches
- Regulatory and compliance fragmentation
For complete list of drivers and restraints, kindly check the Table Of Contents.
Segment Analysis
Property & Casualty dominated revenue with a 58.73% insurtech market share in 2025, reflecting entrenched auto and homeowner demand foundations. Nonetheless, Specialty Lines, encompassing cyber, pet, marine, and travel, are forecast to expand at a 18.63% CAGR through 2031, delivering the fastest incremental premium. Embedded IoT sensors and parametric triggers allow Specialty products to circumvent traditional loss-adjustment delays, creating superior customer experiences that command higher margins. Carriers such as AXA XL have already debuted generative-AI cyber covers to address data-poisoning exposures arising from enterprise AI rollouts. As niche risks proliferate, Specialty innovators can capture outsized wallet-share increases, suggesting the insurtech market size for these lines will compound materially over the forecast window.
Property & Casualty incumbents, meanwhile, leverage telematics to reclaim pricing precision, yet their extensive legacy books create change-management headwinds. Life and Health insurers pilot accelerated underwriting on cloud platforms, but stricter mortality and morbidity regulations temper speed relative to non-regulated specialty covers. Reinsurers increasingly partner with cyber MGAs to collect proprietary claims datasets, improving portfolio modelling accuracy. Given the divergent growth curves, investors may shift capital allocations toward Specialty underwriters that demonstrate robust risk controls and scalable distribution frameworks.
The Insurtech Market Report is Segmented by Product Line (Insurance Type) (Life Insurance, Health Insurance, and More), Distribution Channel (Direct-To-Consumer (D2C) Digital, Aggregators/Marketplaces, and More), End User (Retail/Individual, SME/Commercial, and More), and Geography (North America, South America, and More). The Market Forecasts are Provided in Terms of Value (USD).
Geography Analysis
North America retained 37.25% insurtech market share in 2025, benefiting from deep venture capital pools and established innovation hubs. State-level regulatory competition, exemplified by the Kentucky Insurance Innovation Sandbox, accelerates pilots that often expand nationwide after proof-of-concept results meet solvency criteria. US auto insurers remain early adopters of telematics, while Canadian carriers deploy cloud-native policy administration to overcome geographic service dispersion. M&A activity intensifies as incumbents buy capabilities; Munich Re's USD 2.6 billion purchase of Next Insurance marked a notable 2025 expansion into US primary lines. Although market maturity constrains headline growth, North American carriers drive profit through operating expense reductions and cross-selling of ancillary cyber and identity-protection bundles.
Asia-Pacific, forecast to grow 16.25% annually to 2031, benefits from high smartphone penetration, government-backed fintech policies, and limited legacy system drag. China and India liberalised foreign ownership caps, encouraging global insurers to localise AI underwriting engines on hyperscale clouds with regional data centres. Singapore's Monetary Authority operates a well-defined sandbox and grants digital composite licences that cover life, general, and health, accelerating regional scaling. Japanese carriers tackle longevity risk with AI-enabled annuity pricing, and South Korean platforms integrate usage-based mobility cover into ride-hailing super-apps. Lower insurance penetration leaves ample headroom for first-time buyers, so embedded micro-policies sold alongside e-commerce purchases drive volume even at modest ticket sizes.
Europe sustains steady single-digit growth anchored by GDPR-aligned data-governance frameworks, which give local insurtechs credibility on privacy. The forthcoming EU Data Act will mandate standardised vehicle data access, further catalysing telematics product innovation. The UK pursues post-Brexit regulatory agility, enabling faster product approvals while remaining Solvency II-equivalent for cross-border capital relief. Germany's industrial base spurs demand for advanced commercial and cyber risk solutions, whereas France's sizeable personal-lines market supports scale economics for behavioural-based pricing. As ESG disclosure rules tighten, European carriers innovate parametric climate-risk covers for agriculture and renewable-energy projects, creating exportable frameworks for other regions.
South America along with the Middle East & Africa remain nascent but promising. Mobile-money ecosystems in Brazil, Kenya, and Nigeria increasingly bundle micro-accident and hospital-cash products, leapfrogging traditional agency networks. Government-to-person payment platforms provide instant premium-collection rails, de-risking small-ticket offerings. Sovereign risk pools in the Caribbean and East Africa adopt parametric hurricane and drought solutions that trigger emergency funds within 24 hours, validating proof of concept for broader disaster markets. International development agencies often co-underwrite early portfolios, encouraging private carriers to enter once loss-frequency models mature.
- Lemonade
- Hippo Insurance
- Root Insurance
- Oscar Health
- Bright Health
- Clover Health
- Next Insurance
- ZhongAn
- Wefox
- Alan
- Devoted Health
- Coalition
- Slice Labs
- Metromile
- PolicyBazaar
- Digit Insurance
- ManyPets
- Pie Insurance
- Doma
- Kin Insurance
Additional Benefits:
- The market estimate (ME) sheet in Excel format
- 3 months of analyst support
TABLE OF CONTENTS
1 Introduction
- 1.1 Study Assumptions & Market Definition
- 1.2 Scope of the Study
2 Research Methodology
3 Executive Summary
4 Market Landscape
- 4.1 Market Overview
- 4.2 Market Drivers
- 4.2.1 Rising adoption of AI & ML for underwriting & claims
- 4.2.2 Growing demand for personalized, on-demand insurance products
- 4.2.3 Increasing migration to cloud-native core systems
- 4.2.4 Regulatory sandboxes accelerating product launches
- 4.2.5 Data partnerships with mobility & IoT platforms
- 4.2.6 Rapid growth of embedded distribution models
- 4.3 Market Restraints
- 4.3.1 Legacy core-system integration complexity
- 4.3.2 Regulatory & compliance fragmentation
- 4.3.3 Re-insurance capacity constraints for MGAs
- 4.3.4 Investor pivot from "growth at all costs" to profitability
- 4.4 Value / Supply-Chain Analysis
- 4.5 Regulatory Landscape
- 4.6 Technological Outlook
- 4.7 Porter's Five Forces
- 4.7.1 Bargaining Power of Buyers
- 4.7.2 Bargaining Power of Suppliers
- 4.7.3 Threat of New Entrants
- 4.7.4 Threat of Substitutes
- 4.7.5 Competitive Rivalry
- 4.8 Investment & Funding Landscape
- 4.9 Start-up Ecosystem Analysis
5 Market Size & Growth Forecasts
- 5.1 By Product Line (Insurance Type)
- 5.1.1 Life Insurance
- 5.1.2 Health Insurance
- 5.1.3 Property & Casualty (P&C): Motor, Home, Commercial, Liability, etc.
- 5.1.4 Specialty Lines (e.g., cyber, pet, marine, travel)
- 5.2 By Distribution Channel
- 5.2.1 Direct-to-Consumer (D2C) Digital
- 5.2.2 Aggregators/Marketplaces
- 5.2.3 Digital Brokers/MGAs
- 5.2.4 Embedded Insurance Platforms
- 5.2.5 Traditional Agents/Brokers (digitally enabled)
- 5.2.6 Bancassurance (digitally enabled)
- 5.2.7 Other Channels
- 5.3 By End User
- 5.3.1 Retail/Individual
- 5.3.2 SME/Commercial
- 5.3.3 Large Enterprise/Corporate
- 5.3.4 Government/Public Sector
- 5.4 By Geography (Value, USD Bn)
- 5.4.1 North America
- 5.4.1.1 Canada
- 5.4.1.2 United States
- 5.4.1.3 Mexico
- 5.4.2 South America
- 5.4.2.1 Brazil
- 5.4.2.2 Peru
- 5.4.2.3 Chile
- 5.4.2.4 Argentina
- 5.4.2.5 Rest of South America
- 5.4.3 Europe
- 5.4.3.1 United Kingdom
- 5.4.3.2 Germany
- 5.4.3.3 France
- 5.4.3.4 Spain
- 5.4.3.5 Italy
- 5.4.3.6 BENELUX (Belgium, Netherlands, Luxembourg)
- 5.4.3.7 NORDICS (Denmark, Finland, Iceland, Norway, Sweden)
- 5.4.3.8 Rest of Europe
- 5.4.4 Asia-Pacific
- 5.4.4.1 India
- 5.4.4.2 China
- 5.4.4.3 Japan
- 5.4.4.4 Australia
- 5.4.4.5 South Korea
- 5.4.4.6 South East Asia (Singapore, Malaysia, Thailand, Indonesia, Vietnam, and Philippines)
- 5.4.4.7 Rest of Asia-Pacific
- 5.4.5 Middle East & Africa
- 5.4.5.1 United Arab Emirates
- 5.4.5.2 Saudi Arabia
- 5.4.5.3 South Africa
- 5.4.5.4 Nigeria
- 5.4.5.5 Rest of Middle East & Africa
- 5.4.1 North America
6 Competitive Landscape
- 6.1 Market Concentration
- 6.2 Strategic Moves & Developments
- 6.3 Market Share Analysis
- 6.4 Company Profiles (includes Global level Overview, Market level overview, Core Segments, Financials as available, Strategic Information, Market Rank/Share for key companies, Products & Services, and Recent Developments)
- 6.4.1 Lemonade
- 6.4.2 Hippo Insurance
- 6.4.3 Root Insurance
- 6.4.4 Oscar Health
- 6.4.5 Bright Health
- 6.4.6 Clover Health
- 6.4.7 Next Insurance
- 6.4.8 ZhongAn
- 6.4.9 Wefox
- 6.4.10 Alan
- 6.4.11 Devoted Health
- 6.4.12 Coalition
- 6.4.13 Slice Labs
- 6.4.14 Metromile
- 6.4.15 PolicyBazaar
- 6.4.16 Digit Insurance
- 6.4.17 ManyPets
- 6.4.18 Pie Insurance
- 6.4.19 Doma
- 6.4.20 Kin Insurance
7 Market Opportunities & Future Outlook
- 7.1 White-space & Unmet-Need Assessment

