
PUBLISHER: Mordor Intelligence | PRODUCT CODE: 1851794

PUBLISHER: Mordor Intelligence | PRODUCT CODE: 1851794
Augmented Analytics - Market Share Analysis, Industry Trends & Statistics, Growth Forecasts (2025 - 2030)
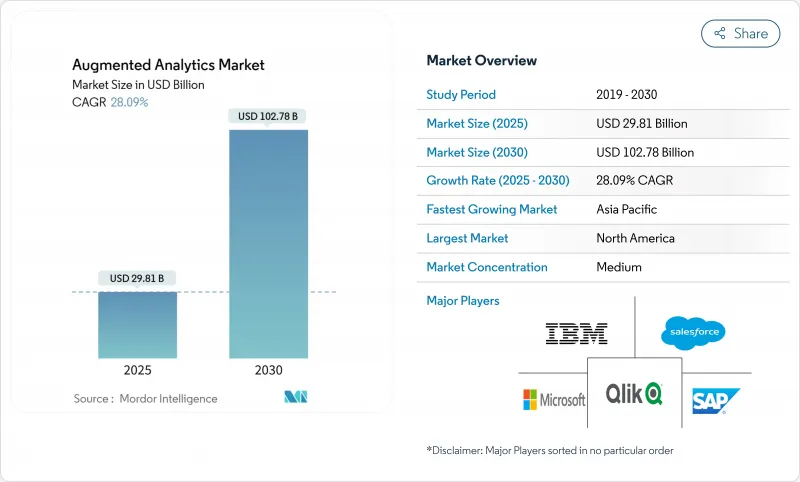
The Augmented Analytics Market size is estimated at USD 29.81 billion in 2025, and is expected to reach USD 102.78 billion by 2030, at a CAGR of 28.09% during the forecast period (2025-2030).
Revenue momentum shifts from proof-of-concepts to enterprise-wide deployments as large-language-model (LLM) functions become standard features inside mainstream business-intelligence suites. Natural-language querying, automated insight generation, and AI agents that execute workflows reduce analytics backlogs and shorten decision cycles, elevating data-driven culture across every business layer. Cloud platforms remain dominant, yet hybrid architectures gain traction because data-sovereignty mandates require on-premises processing for sensitive workloads. Vendor competition intensifies around orchestration tools that coordinate AI tasks between edge, private cloud, and public regions. Services demand accelerates as organisations seek partners to redesign governance, reskill workers, and fine-tune foundation models for domain specificity. Supply-chain bottlenecks for high-performance GPUs and rising inference costs temper near-term scaling plans, but road-map investments by hyperscalers indicate sustained infrastructure build-out through 2026.
Global Augmented Analytics Market Trends and Insights
Rising demand to analyse multi-structured data
Nearly 80% of enterprise information is unstructured, spanning documents, images, and machine logs. Advanced language and vision models now parse these formats alongside classic tabular datasets, giving analysts a single discovery surface. Automotive manufacturers use the capability to fuse sensor telemetry with maintenance manuals and raise downtime-forecasting accuracy by 85%. Hospitals are combining radiology scans, clinical notes, and genomic profiles to refine diagnostic pathways. The ability to tap these untapped data pools pushes organisations toward platforms that embed AI-native parsers, reinforcing growth for the augmented analytics market.
Self-service BI and data-democratisation push
Natural-language prompts let marketing managers, finance controllers, and call-centre supervisors run complex queries without SQL. This shift cuts request-to-insight cycles from weeks to minutes and frees data-engineering teams for higher-value tasks. ThoughtSpot's integration with Google's Gemini models shows how conversational search hides complexity while returning governed, shareable answers. Higher usage rates improve data-literacy feedback loops, anchoring analytics culture, and lifting the augmented analytics market further.
Data-privacy and security concerns
GDPR and sectoral rules require explicit consent, data minimisation, and audit trails, making unfettered AI experimentation risky. Vendors now launch "sovereign cloud" zones inside regional data centres; MicroStrategy partnered with STACKIT to deliver an EU-compliant stack hosted in Germany and Austria. Compliance overhead slows project rollout, trimming near-term spending even as long-term trust builds.
Other drivers and restraints analyzed in the detailed report include:
- SME uptake via cloud subscriptions
- Generative-AI infused analytics suites
- Workforce anxiety over human-replacement
For complete list of drivers and restraints, kindly check the Table Of Contents.
Segment Analysis
Software accounted for 78% revenue in 2024 as buyers gravitated toward end-to-end suites bundling ingestion, modelling, and visualisation. In monetary terms, the segment contributed USD 23.27 billion to the augmented analytics market size. Continuous feature releases, such as in-product LLM chatbots, lock in renewals and upsell paths. The services segment, although smaller, is scaling at 28.96% CAGR on the back of implementation, model-governance, and user-adoption projects. As multi-cloud estates grow, clients commission partners to handle policy design, testing, and ROI baselining. Vendor professional-services groups tap this opportunity, while global system integrators build 1,000-person AI studios to capture demand.
Second-order effects reinforce software primacy. When Snowflake embedded Anthropic's models inside its Cortex service, customers accessed generative summarisation without exporting data, tightening platform dependence. Over the forecast horizon, open-source AI components will evolve, yet buyers still prefer commercial wrappers that guarantee security patches and legal indemnities, sustaining the software segment's lead within the augmented analytics market.
Cloud installations generated 61% of total spending in 2024. Financial-services firms, online marketplaces, and streaming networks exploit elasticity for holiday spikes and model-training bursts. However, strict residency mandates push critical workloads to private zones, propelling hybrid setups at a 30.22% CAGR. The hybrid share of the augmented analytics market is projected to rise from USD 18.19 billion in 2025 to USD 71.34 billion by 2030. Edge devices process personally identifiable information locally, then forward aggregated patterns to cloud AI for deeper inference, balancing compliance with analytic depth.
Edge-to-cloud orchestration tools signal the next battleground: platforms must schedule SQL, vector-search, and reinforcement-learning jobs across Kubernetes clusters on both sides of the firewall. Providers able to auto-deploy containers, govern encryption keys, and optimise latency stand to capture an outsized wallet share. On-premises-only deployments remain relevant for nuclear energy, defence, and pharmaceuticals, but growth lags behind hybrid because hardware refresh cycles elongate in capex-constrained sectors.
The Augmented Analytics Market Report is Segmented by Component (Software and Services), Deployment (On-Premise, Cloud, and Hybrid), Organization Size (Large Enterprises and Small and Mid-Size Enterprises), End-User Industry (BFSI, Telecom and IT, Retail and Consumer Goods, Healthcare and Life Sciences, Manufacturing, Media and Entertainment, and Government and Public Sector), and Geography.
Geography Analysis
North America generated 48% of global revenue in 2024 and retains structural advantages: dense cloud-region footprint, venture-capital pipelines, and AI-skilled labour pools. Fortune 500 firms institutionalise AI centre-of-excellence charters, embedding analytics inside finance, supply-chain, and HR apps. Federal funding for AI research and streamlined IPO pathways attract startups that refresh the competitive arena. However, data-localisation clauses in Canada, California Consumer Privacy Act amendments, and antitrust scrutiny introduce compliance spend, nudging firms toward multi-jurisdictional hybrid architectures.
Asia-Pacific, while smaller today, is on a 28.80% CAGR trajectory through 2030. Government allocations exceed USD 500 billion for AI infrastructure, semiconductors, and talent development. China's AI hub in Shenzhen offers subsidised GPU clusters; India's Digital Personal Data Protection Act sets guardrails while encouraging domestic innovation. Manufacturing conglomerates cluster around Tokyo, Seoul, and Singapore, creating demand flywheels for shop-floor predictive analytics. Local vendors integrate Mandarin, Hindi, and Bahasa speech models, meeting linguistic requirements and giving regional players an edge. The augmented analytics market thus finds its fastest volume expansion in APAC geographies.
Europe continues to post mid-teen growth even as GDPR and the forthcoming AI Act heighten vendor obligations. Enterprises in Germany's Mittelstand adopt sovereign-cloud deployments inside national borders. French public-sector agencies run analytics in isolated regions to comply with citizen-data statutes. Vendor road maps now include "EU trusted zone" labels, reflecting the continent's regulatory pull. North-to-south digital-skills disparities persist, but EU-funded reskilling programmes close gaps, supporting steady adoption.
Latin America, the Middle East, and Africa represent later-stage opportunities, together projected to account for just under 10% of the augmented analytics market by 2030. Mobile-first business models, rising fintech penetration, and under-banked populations create analytics needs around credit scoring and fraud detection. Cloud-region launches in Sao Paulo, Riyadh, and Johannesburg lower latency and address data-residency rules, unlocking pilot budgets that convert to production workloads when ROI materialises.
- Microsoft Corporation
- Salesforce Inc. (incl. Tableau)
- SAP SE
- International Business Machines Corp.
- QlikTech International AB
- Google LLC (Looker)
- Oracle Corporation
- SAS Institute Inc.
- TIBCO Software Inc.
- ThoughtSpot Inc.
- MicroStrategy Inc.
- Sisense Inc.
- GoodData Corp.
- Alteryx Inc.
- Domo Inc.
- Zoho Corporation (Zoho Analytics)
- Amazon Web Services - QuickSight
- Yellowfin BI
- Board International
Additional Benefits:
- The market estimate (ME) sheet in Excel format
- 3 months of analyst support
TABLE OF CONTENTS
1 INTRODUCTION
- 1.1 Study Assumptions and Market Definition
- 1.2 Scope of the Study
2 RESEARCH METHODOLOGY
3 EXECUTIVE SUMMARY
4 MARKET LANDSCAPE
- 4.1 Market Overview
- 4.2 Market Drivers
- 4.2.1 Rising demand to analyse multi-structured data
- 4.2.2 Self-service BI and data-democratisation push
- 4.2.3 SME uptake via cloud subscriptions
- 4.2.4 Generative-AI infused analytics suites
- 4.2.5 Edge-tier deployments for data sovereignty
- 4.2.6 SaaS copilot-led embedded-analytics monetisation
- 4.3 Market Restraints
- 4.3.1 Data-privacy and security concerns
- 4.3.2 Workforce anxiety over human-replacement
- 4.3.3 Prompt-engineering skill gap
- 4.3.4 GPU scarcity and inference cost inflation
- 4.4 Value/Supply-Chain Analysis
- 4.5 Regulatory Landscape
- 4.6 Technological Outlook
- 4.7 Porter's Five Forces Analysis
- 4.7.1 Threat of New Entrants
- 4.7.2 Bargaining Power of Buyers
- 4.7.3 Bargaining Power of Suppliers
- 4.7.4 Threat of Substitutes
- 4.7.5 Competitive Rivalry
5 MARKET SIZE AND GROWTH FORECASTS (VALUE)
- 5.1 By Component
- 5.1.1 Software
- 5.1.2 Services
- 5.2 By Deployment
- 5.2.1 On-premise
- 5.2.2 Cloud
- 5.2.3 Hybrid
- 5.3 By Organisation Size
- 5.3.1 Large Enterprises
- 5.3.2 Small and Mid-size Enterprises
- 5.4 By End-user Industry
- 5.4.1 BFSI
- 5.4.2 Telecom and IT
- 5.4.3 Retail and Consumer Goods
- 5.4.4 Healthcare and Life Sciences
- 5.4.5 Manufacturing
- 5.4.6 Media and Entertainment
- 5.4.7 Government and Public Sector
- 5.5 By Geography
- 5.5.1 North America
- 5.5.1.1 US
- 5.5.1.2 Canada
- 5.5.1.3 Mexico
- 5.5.2 South America
- 5.5.2.1 Brazil
- 5.5.2.2 Argentina
- 5.5.2.3 Rest of South America
- 5.5.3 Europe
- 5.5.3.1 Germany
- 5.5.3.2 UK
- 5.5.3.3 France
- 5.5.3.4 Italy
- 5.5.3.5 Russia
- 5.5.4 Asia Pacific
- 5.5.4.1 China
- 5.5.4.2 Japan
- 5.5.4.3 India
- 5.5.4.4 South Korea
- 5.5.4.5 Rest of Asia Pacific
- 5.5.5 Middle East
- 5.5.5.1 Saudi Arabia
- 5.5.5.2 United Arab Emirates
- 5.5.5.3 Qatar
- 5.5.5.4 Rest of Middle East
- 5.5.6 Africa
- 5.5.6.1 South Africa
- 5.5.6.2 Nigeria
- 5.5.6.3 Rest of Africa
- 5.5.1 North America
6 COMPETITIVE LANDSCAPE
- 6.1 Market Concentration
- 6.2 Strategic Moves
- 6.3 Market Share Analysis
- 6.4 Company Profiles (includes Global level Overview, Market level overview, Core Segments, Financials as available, Strategic Information, Market Rank/Share for key companies, Products and Services, and Recent Developments)
- 6.4.1 Microsoft Corporation
- 6.4.2 Salesforce Inc. (incl. Tableau)
- 6.4.3 SAP SE
- 6.4.4 International Business Machines Corp.
- 6.4.5 QlikTech International AB
- 6.4.6 Google LLC (Looker)
- 6.4.7 Oracle Corporation
- 6.4.8 SAS Institute Inc.
- 6.4.9 TIBCO Software Inc.
- 6.4.10 ThoughtSpot Inc.
- 6.4.11 MicroStrategy Inc.
- 6.4.12 Sisense Inc.
- 6.4.13 GoodData Corp.
- 6.4.14 Alteryx Inc.
- 6.4.15 Domo Inc.
- 6.4.16 Zoho Corporation (Zoho Analytics)
- 6.4.17 Amazon Web Services - QuickSight
- 6.4.18 Yellowfin BI
- 6.4.19 Board International
7 MARKET OPPORTUNITIES AND FUTURE OUTLOOK
- 7.1 White-space and Unmet-need Assessment

