
PUBLISHER: Mordor Intelligence | PRODUCT CODE: 1851877

PUBLISHER: Mordor Intelligence | PRODUCT CODE: 1851877
Medical Dynamometer - Market Share Analysis, Industry Trends & Statistics, Growth Forecasts (2025 - 2030)
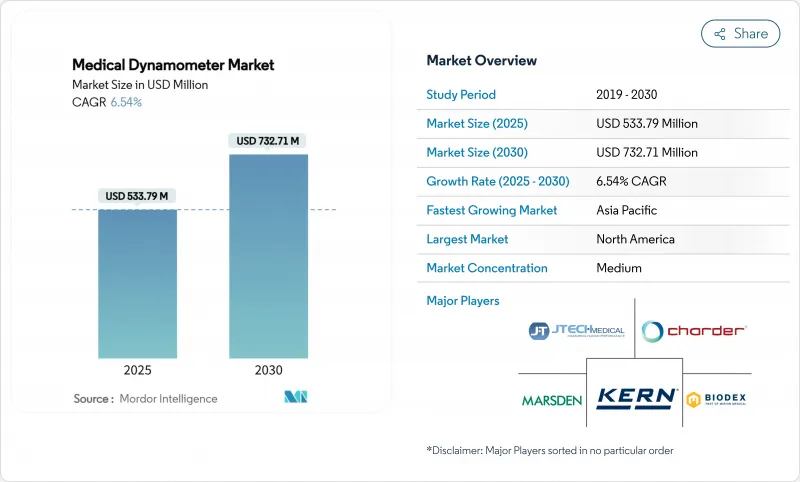
The medical dynamometer market size is USD 533.79 million in 2025 and is forecast to reach USD 732.71 million in 2030, advancing at a 6.54% CAGR.
Demand stems from an aging global population, the clinical recognition of sarcopenia as a distinct disorder, and the rising use of precise muscle-strength data to guide value-based care. Device connectivity has shifted from optional to essential, linking dynamometers to electronic health records and virtual-rehab platforms. Hospitals view connected systems as labor-saving diagnostic tools, while payers reward objective outcome measures generated by these devices. Manufacturers able to merge sensors, analytics, and cloud-based dashboards continue to gain traction.
Global Medical Dynamometer Market Trends and Insights
Ageing Population & Sarcopenia Prevalence
Clinical guidelines now classify sarcopenia as a stand-alone condition that warrants early screening in primary care. Global prevalence reaches 21% among older adults, and Chinese cohort data link low grip strength to hip-fracture risk. Hospitals embed handheld dynamometers into geriatric checkups to flag mobility decline and tailor strength-training plans. Community clinics prefer portable units that withstand frequent transit between locations. Digital dashboards aggregate grip-strength baselines, enabling clinicians to spot rapid deterioration and intervene before fall-related admissions increase costs.
Rising Incidence of Osteoporosis
Asia-Pacific reports osteoporosis rates as high as 30% for women aged 40+ and fracture incidence up to 1,000 per 100,000 person-years. Orthopedic departments appreciate that weak grip strength predicts fragility fractures and use dynamometers as low-cost triage tools when DEXA scanners are unavailable. Retail pharmacies in Japan have begun community screening days with smartphone-linked devices that upload anonymized data to hospital networks. Public-health agencies now list dynamometer grip testing alongside bone-density scans in fall-prevention guidelines, broadening procurement budgets.
High Device & Calibration Cost
Annual calibration expenses run 3-5% of a clinic's equipment budget, and FDA rules mandate certified service providers. Small practices often delay recalibration, risking inaccurate readings that can compromise treatment outcomes. Some vendors now bundle multiyear calibration contracts into leasing models to smooth cash flow. Cloud-based self-diagnostics help users schedule service only when drift exceeds thresholds, cutting downtime. Despite such aids, sticker shock still stalls purchases in community hospitals across Latin America.
Other drivers and restraints analyzed in the detailed report include:
- Integration With Digital MSK-Care Platforms
- Expanding Physiotherapy & Rehab Reimbursement
- Shortage of Trained Clinicians in Emerging Markets
For complete list of drivers and restraints, kindly check the Table Of Contents.
Segment Analysis
Hand dynamometers generated 37.51% of 2024 revenue, underlining their role as the baseline tool for quick grip assessments in primary care. However, smart multifunction models are scaling at a 13.25% CAGR, aided by embedded inertial sensors that capture peak, average, and endurance force in one trial. Push-pull devices dominate ergonomic audits in manufacturing plants, where safety officers use force data to redesign workflows. Chest dynamometers, though niche, gained adoption in post-COVID pulmonary rehab programs that monitor inspiratory-muscle strength. Recent designs integrate rechargeable lithium packs, cutting battery replacement costs by 60% and supporting green-procurement mandates.
The medical dynamometer market increasingly rewards suppliers that pair hardware with robust analytics. Cloud dashboards deliver color-coded progress charts to therapists and export HL7-compliant files to hospital record systems, eliminating manual data entry. Companies introducing subscription-based software layers report 25% higher customer retention. As tariffs on Chinese components reached 125% in 2025, North American firms reshored sensor assembly to mitigate supply-chain risk. The shift lifted average selling prices but created marketing room for "domestic-origin" quality claims that resonate with veterans-affairs buyers.
The Medical Dynamometer Market Report is Segmented by Product (Chest Dynamometer, Hand Dynamometer, Push-Pull Dynamometer, and More), Application (Orthopedics & Sports Medicine, Neurology & Stroke Rehab, Cardiology & Pulmonary Rehab, and More), End-User (Hospitals & Clinics, Rehabilitation Centers, and More), and Geography (North America, Europe, Asia-Pacific, and More). The Market Forecasts are Provided in Terms of Value (USD).
Geography Analysis
North America generated 35.32% of 2024 revenue, buoyed by high procedure volumes, universal private-payer coverage for outpatient rehab, and early adoption of cloud-linked devices. Large integrated health networks, including Kaiser Permanente and the Veterans Health Administration, now specify data-interoperable dynamometers in tenders. Federal guidelines that reimburse remote therapeutic monitoring further expand order volumes. Domestic manufacturers promote tariffs as catalysts for local production, appealing to public-sector buyers seeking supply-chain resilience.
Asia-Pacific is the fastest-growing region at a 10.71% CAGR to 2030, underpinned by aging demographics and proactive musculoskeletal screening campaigns in Japan, South Korea, and China. Chinese companies now account for more than 80% of component supply to top global brands, which shortens lead times and supports customized builds. Government stimulus funds in Indonesia and India earmark grants for digital rehab equipment in secondary-tier cities, widening access beyond metropolitan hospitals. Regional suppliers leverage language-localized apps to penetrate community health centers.
Europe represents a mature but innovation-driven landscape. Enforcement of the Medical Device Regulation raises documentation costs, yet manufacturers that achieve certification enjoy reduced competitive clutter. Ergonomic-screening mandates such as the 2024 Amazon-OSHA agreement create fresh demand in industrial health and safety. Public-sector tenders prioritize carbon-footprint disclosures, prompting suppliers to shift packaging to biodegradable materials. The European Space Agency's pilot program assessing astronaut grip strength for muscle-atrophy research offers niche-market publicity that drives hospital interest in similar tech.
- JTECH Medical Industries
- KERN & SOHN
- Charder Electronics
- Marsden Weighing Group
- Mirion Technologies, Inc. (Biodex Medical Systems)
- Fabrication Enterprises
- North Coast Medical
- Lafayette Instrument
- VALD Performance
- BTE Technologies
- Detecto Scale
- Patterson Medical / Performance Health
- KINVENT Biomechanics
- Hoggan Scientific
- GripAble
- Chatillon (AMETEK)
- Hausmann Industries
- MedStrength
- Stryker
- Bionik Laboratories
Additional Benefits:
- The market estimate (ME) sheet in Excel format
- 3 months of analyst support
TABLE OF CONTENTS
1 Introduction
- 1.1 Study Assumptions & Market Definition
- 1.2 Scope of the Study
2 Research Methodology
3 Executive Summary
4 Market Landscape
- 4.1 Market Overview
- 4.2 Market Drivers
- 4.2.1 Rising Incidence Of Osteoporosis
- 4.2.2 Increasing Sports-Related Musculoskeletal Injuries
- 4.2.3 Ageing Population & Sarcopenia Prevalence
- 4.2.4 Expanding Physiotherapy & Rehab Reimbursement
- 4.2.5 Integration With Digital Msk-Care Platforms
- 4.2.6 Workplace Ergonomic-Screening Mandates
- 4.3 Market Restraints
- 4.3.1 High Device & Calibration Cost
- 4.3.2 Shortage Of Trained Clinicians In Emerging Markets
- 4.3.3 Low-Cost Asian Imports Eroding ASPs
- 4.3.4 Data-Integration & Interoperability Gaps
- 4.4 Technological Outlook
- 4.5 Porter's Five Forces
- 4.5.1 Threat of New Entrants
- 4.5.2 Bargaining Power of Buyers
- 4.5.3 Bargaining Power of Suppliers
- 4.5.4 Threat of Substitutes
- 4.5.5 Competitive Rivalry
5 Market Size & Growth Forecasts (Value, USD)
- 5.1 By Product
- 5.1.1 Chest Dynamometer
- 5.1.2 Hand Dynamometer
- 5.1.3 Push-Pull Dynamometer
- 5.1.4 Squeeze/Grip Dynamometer
- 5.1.5 Multifunction & Smart App-enabled Dynamometer
- 5.2 By Application
- 5.2.1 Orthopedics & Sports Medicine
- 5.2.2 Neurology & Stroke Rehab
- 5.2.3 Cardiology & Pulmonary Rehab
- 5.2.4 Medical Trauma & Post-operative
- 5.2.5 Others
- 5.3 By End-User
- 5.3.1 Hospitals & Clinics
- 5.3.2 Rehabilitation Centers
- 5.3.3 Home-care & Tele-rehab Settings
- 5.3.4 Occupational Health & Sports Facilities
- 5.4 Geography
- 5.4.1 North America
- 5.4.1.1 United States
- 5.4.1.2 Canada
- 5.4.1.3 Mexico
- 5.4.2 Europe
- 5.4.2.1 Germany
- 5.4.2.2 United Kingdom
- 5.4.2.3 France
- 5.4.2.4 Italy
- 5.4.2.5 Spain
- 5.4.2.6 Rest of Europe
- 5.4.3 Asia-Pacific
- 5.4.3.1 China
- 5.4.3.2 Japan
- 5.4.3.3 India
- 5.4.3.4 South Korea
- 5.4.3.5 Australia
- 5.4.3.6 Rest of Asia-Pacific
- 5.4.4 Middle East and Africa
- 5.4.4.1 GCC
- 5.4.4.2 South Africa
- 5.4.4.3 Rest of Middle East and Africa
- 5.4.5 South America
- 5.4.5.1 Brazil
- 5.4.5.2 Argentina
- 5.4.5.3 Rest of South America
- 5.4.1 North America
6 Competitive Landscape
- 6.1 Market Concentration
- 6.2 Market Share Analysis
- 6.3 Company Profiles (includes Global level Overview, Market level overview, Core Segments, Financials as available, Strategic Information, Market Rank/Share for key companies, Products & Services, and Recent Developments)
- 6.3.1 JTECH Medical Industries
- 6.3.2 KERN & SOHN
- 6.3.3 Charder Electronics
- 6.3.4 Marsden Weighing Group
- 6.3.5 Mirion Technologies, Inc. (Biodex Medical Systems)
- 6.3.6 Fabrication Enterprises
- 6.3.7 North Coast Medical
- 6.3.8 Lafayette Instrument
- 6.3.9 VALD Performance
- 6.3.10 BTE Technologies
- 6.3.11 Detecto Scale
- 6.3.12 Patterson Medical / Performance Health
- 6.3.13 KINVENT Biomechanics
- 6.3.14 Hoggan Scientific
- 6.3.15 GripAble
- 6.3.16 Chatillon (AMETEK)
- 6.3.17 Hausmann Industries
- 6.3.18 MedStrength
- 6.3.19 Stryker Corporation
- 6.3.20 Bionik Laboratories
7 Market Opportunities & Future Outlook
- 7.1 White-space & Unmet-Need Assessment

