
PUBLISHER: Mordor Intelligence | PRODUCT CODE: 1851894

PUBLISHER: Mordor Intelligence | PRODUCT CODE: 1851894
Cell Isolation - Market Share Analysis, Industry Trends & Statistics, Growth Forecasts (2025 - 2030)
The cell isolation market size stands at USD 15.76 billion in 2025 and is forecast to reach USD 30.14 billion in 2030, expanding at a 13.85% CAGR over the period.
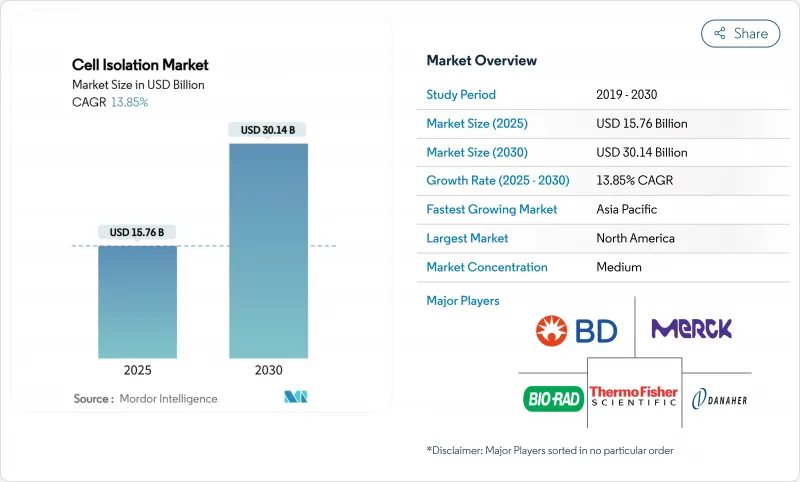
Expansion is propelled by accelerating adoption of cell-based therapies, sustained public- and private-sector research funding, and a rapid build-out of biopharmaceutical manufacturing capacity. Automation-ready instruments, especially high-parameter flow cytometers and integrated microfluidic platforms, are moving from research laboratories to GMP suites, shortening development timelines for cell therapies and precision diagnostics. North America remains the largest regional contributor, while Asia-Pacific posts the fastest growth on the strength of government grants and infrastructure investments. Regulatory cost pressure and a severe shortage of skilled technologists are intensifying the need for turn-key, user-friendly platforms that minimize hands-on time and ensure compliance with evolving quality standards.
Global Cell Isolation Market Trends and Insights
Growing Adoption of Cell-Based Therapies
FDA approvals for 37 cell and gene therapy products in 2024 underscore a clinical shift toward living medicines that require precise cell isolation workflows. CAR-T programs are multiplying, and cost-optimized, allogeneic platforms are moving into pivotal trials, magnifying demand for standardized, high-throughput selection of lymphocyte subsets. Brazil's USD 35,000 CAR-T program illustrates how regional cost innovation can unlock new patient cohorts and expand the addressable cell isolation market. As pipeline volume rises, scalability and batch-to-batch consistency become decisive purchase criteria for instruments and reagents.
Rising Funding for Life-Science Research
NIH High-End Instrumentation (HEI) and Shared Instrumentation Grant programs collectively disburse up to USD 2 million per award for flow cytometers and cell analyzers, anchoring a predictable domestic demand cycle. Venture investors echo public enthusiasm: Garuda Therapeutics raised USD 50 million in Series A-1 financing for off-the-shelf stem-cell platforms, underscoring private-sector confidence in innovative isolation technologies. Regional technology hubs such as the Corvallis Microfluidics Technology Hub (planned 5,000-12,000 jobs by 2033) pool talent, infrastructure, and capital, accelerating product commercialization.
High Cost of Advanced Instruments
Top-end cell sorters often list above USD 1 million, limiting access for smaller institutes and emerging-market labs. FDA alignment with ISO 13485 by February 2026 will oblige manufacturers to overhaul quality systems, adding compliance overhead and potentially inflating price tags. Even reduced 510(k) fees of USD 6,084 for qualified small businesses strain startup budgets. This capital barrier nudges users toward leasing models and centralized core facilities.
Other drivers and restraints analyzed in the detailed report include:
- Technological Advancements in Cell Separation Platforms
- Increasing Prevalence of Chronic Diseases
- Stringent Regulatory and Compliance Requirements
For complete list of drivers and restraints, kindly check the Table Of Contents.
Segment Analysis
Consumables generated 62.34% of 2024 revenues owing to continual replenishment of antibodies, magnetic beads, density media, and disposable cartridges. Reagents customized for CAR-T workflows and GMP-grade buffers command premium pricing, ensuring stable annuity streams for suppliers. Instrument growth, though from a smaller base, is forecast at 15.65% CAGR as users replace manual centrifuges with closed, automated systems that integrate cell washing, volume reduction, and enrichment in a single run. Early adopters report labor savings of up to 40% and lower contamination events, validating ROI assumptions.
The cell isolation market size derived from instruments is set to rise sharply as multi-modal platforms blend magnetic, acoustic, and optical forces within one compact chassis, reducing footprint by 30% relative to legacy layouts. Vendors now bundle consumables under subscription plans that flatten year-one capital outlay, broadening access for mid-tier hospitals. The strategy also locks in reagent pull-through, reinforcing vendor stickiness.
MACS retained 45.34% of cell isolation market share in 2024 on account of proven protocols, wide antibody menus, and scalable column formats. Yet microfluidic lab-on-chip devices are recording a 16.01% CAGR, fueled by single-cell omics where precise capture of scarce populations is essential. Researchers cite 75% lower sample and reagent consumption alongside reduced operator exposure to biohazards.
The cell isolation market size attributable to microfluidics will grow further as AI-guided droplet generators achieve sub-100 µm precision, enabling downstream barcoding for high-content sequencing. Hybrid platforms now marry dielectrophoretic pre-enrichment with magnetic-bead polishing to reach >98% purity in one continuous flow, shortening setup time and preserving cell viability for sensitive applications.
The Cell Isolation Market Report is Segmented by Product (Consumables and Instruments), Technique (Density-Gradient Centrifugation, and More), Cell Type (Human and Animal), Cell Source (Peripheral Blood, Bone Marrow, and More), End-User (Research Labs, Biotech Companies, Cros, and Diagnostic Labs), and Geography (North America, Europe, Asia-Pacific, MEA, South America). The Market Forecasts are Provided in Terms of Value (USD).
Geography Analysis
North America generated 41.23% of 2024 revenue, sustained by NIH grant cycles and high clinical-trial density. Thermo Fisher's USD 10.36 billion first-quarter 2025 revenue, bolstered by its USD 4.1 billion Solventum acquisition, confirms robust instrument pull-through. Yet the region's 20,000-25,000 technologist shortfall lifts demand for turnkey platforms that embed AI-driven quality checks to ease regulatory audits.
Asia-Pacific posts a 14.56% CAGR, the fastest among all regions, buoyed by state subsidies and capacity additions across China, South Korea, and India. China hosted 37% of global clinical trials in 2024, catalyzing uptake of microfluidic isolators aligned with domestic GMP. South Korea's Fast Track pathway for regenerative medicines accelerates approval timelines by up to 12 months, motivating early equipment purchases by local CDMOs. Indigenous CAR-T entrants in India signal a shift toward regional supply chains, expanding the prospective customer base for mid-priced instruments.
Europe maintains solid demand despite tighter regulatory scrutiny under the EU Clinical Trials Regulation. Academic-industry consortia leverage Horizon Europe grants to finance spectral-cytometry upgrades, ensuring steady replacement cycles. Meanwhile, Latin America shows promise as Brazil's USD 35,000 CAR-T program spotlights cost-conscious innovation, although reimbursement uncertainties temper immediate uptake. Middle East & Africa demand is nascent but rising as governments invest in transplant centers and immuno-oncology hubs.
- Thermo Fisher Scientific
- Beckton Dickinson
- Miltenyi Biotec
- Merck KGaA (MilliporeSigma)
- Danaher
- Bio-Rad Laboratories
- Stem Cell Technologies
- Terumo
- Corning
- Akadeum Life Sciences
- Sony Biotechnology
- NanoCellect Biomedical
- Union Biometrica
- Owl Biomedical
- Invent Biotechnologies Inc.
- Bio-Techne (R&D Systems)
- RareCyte Inc.
- Precision Biosciences
- Zeiss Group (Cell Observer)
- PluriSelect Life Science UG
- DeNovo Software
Additional Benefits:
- The market estimate (ME) sheet in Excel format
- 3 months of analyst support
TABLE OF CONTENTS
1 Introduction
- 1.1 Study Assumptions & Market Definition
- 1.2 Scope Of The Study
2 Research Methodology
3 Executive Summary
4 Market Landscape
- 4.1 Market Overview
- 4.2 Market Drivers
- 4.2.1 Growing Adoption of Cell-Based Therapies
- 4.2.2 Rising Funding for Life Science Research
- 4.2.3 Technological Advancements in Cell Separation Platforms
- 4.2.4 Increasing Prevalence of Chronic Diseases
- 4.2.5 Expansion of Biopharmaceutical Manufacturing Capacity
- 4.2.6 Emergence of Personalized Medicine And Precision Diagnostics
- 4.3 Market Restraints
- 4.3.1 High Cost of Advanced Instruments
- 4.3.2 Stringent Regulatory and Compliance Requirements
- 4.3.3 Limited Skilled Workforce in Flow Cytometry
- 4.3.4 Ethical Concerns and Sample Sourcing Challenges
- 4.4 Regulatory Landscape
- 4.5 Technological Outlook
- 4.6 Porter's Five Forces Analysis
- 4.6.1 Threat Of New Entrants
- 4.6.2 Bargaining Power Of Buyers
- 4.6.3 Bargaining Power Of Suppliers
- 4.6.4 Threat Of Substitutes
- 4.6.5 Intensity Of Competitive Rivalry
5 Market Size & Growth Forecasts (Value, USD)
- 5.1 By Product
- 5.1.1 Consumables
- 5.1.1.1 Reagents & Kits
- 5.1.1.2 Beads (Magnetic, Polymer)
- 5.1.1.3 Disposables (Tubes, Columns, Filters)
- 5.1.2 Instruments
- 5.1.2.1 Centrifuges
- 5.1.2.2 Flow Cytometers / FACS
- 5.1.2.3 Magnetic-Activated Cell Separator Systems
- 5.1.2.4 Microfluidic & Acoustic Isolation Systems
- 5.1.2.5 Filtration Platforms
- 5.1.1 Consumables
- 5.2 By Technique
- 5.2.1 Density-Gradient Centrifugation
- 5.2.2 Magnetic-Activated Cell Separation (MACS)
- 5.2.3 Fluorescence-Activated Cell Sorting (FACS)
- 5.2.4 Microfluidics & Lab-On-Chip Isolation
- 5.2.5 Filtration & Sieving
- 5.2.6 Dielectrophoresis & Acoustic Sorting
- 5.3 By Cell Type
- 5.3.1 Human Cells
- 5.3.2 Animal Cells
- 5.4 By Cell Source
- 5.4.1 Peripheral Blood
- 5.4.2 Bone Marrow
- 5.4.3 Cord Blood & Perinatal Tissues
- 5.4.4 Tumor Tissue / Solid Tissue Digests
- 5.5 By End-User
- 5.5.1 Research Laboratories & Academic Institutes
- 5.5.2 Biotechnology & Biopharmaceutical Companies
- 5.5.3 Contract Research & Manufacturing Organizations
- 5.5.4 Diagnostic & Reference Laboratories
- 5.6 Geography
- 5.6.1 North America
- 5.6.1.1 United States
- 5.6.1.2 Canada
- 5.6.1.3 Mexico
- 5.6.2 Europe
- 5.6.2.1 Germany
- 5.6.2.2 United Kingdom
- 5.6.2.3 France
- 5.6.2.4 Italy
- 5.6.2.5 Spain
- 5.6.2.6 Rest of Europe
- 5.6.3 Asia-Pacific
- 5.6.3.1 China
- 5.6.3.2 Japan
- 5.6.3.3 India
- 5.6.3.4 Australia
- 5.6.3.5 South Korea
- 5.6.3.6 Rest of Asia-Pacific
- 5.6.4 Middle East & Africa
- 5.6.4.1 GCC
- 5.6.4.2 South Africa
- 5.6.4.3 Rest of Middle East & Africa
- 5.6.5 South America
- 5.6.5.1 Brazil
- 5.6.5.2 Argentina
- 5.6.5.3 Rest of South America
- 5.6.1 North America
6 Competitive Landscape
- 6.1 Market Concentration
- 6.2 Market Share Analysis
- 6.3 Company Profiles (includes Global level Overview, Market level overview, Core Business Segments, Financials, Headcount, Key Information, Market Rank, Market Share, Products and Services, and analysis of Recent Developments)
- 6.3.1 Thermo Fisher Scientific Inc.
- 6.3.2 Becton, Dickinson & Company
- 6.3.3 Miltenyi Biotec
- 6.3.4 Merck KGaA (MilliporeSigma)
- 6.3.5 Danaher Corporation (Cytiva)
- 6.3.6 Bio-Rad Laboratories Inc.
- 6.3.7 STEMCELL Technologies Inc.
- 6.3.8 Terumo Corporation
- 6.3.9 Corning Inc.
- 6.3.10 Akadeum Life Sciences Inc.
- 6.3.11 Sony Biotechnology Inc.
- 6.3.12 NanoCellect Biomedical
- 6.3.13 Union Biometrica Inc.
- 6.3.14 Owl Biomedical
- 6.3.15 Invent Biotechnologies Inc.
- 6.3.16 Bio-Techne (R&D Systems)
- 6.3.17 RareCyte Inc.
- 6.3.18 Precision Biosciences
- 6.3.19 Zeiss Group (Cell Observer)
- 6.3.20 PluriSelect Life Science UG
- 6.3.21 DeNovo Software
7 Market Opportunities & Future Outlook
- 7.1 White-Space & Unmet-Need Assessment

