
PUBLISHER: Mordor Intelligence | PRODUCT CODE: 1940605

PUBLISHER: Mordor Intelligence | PRODUCT CODE: 1940605
Trash Bags - Market Share Analysis, Industry Trends & Statistics, Growth Forecasts (2026 - 2031)
The trash bags market was valued at USD 13.53 billion in 2025 and estimated to grow from USD 14.36 billion in 2026 to reach USD 19.37 billion by 2031, at a CAGR of 6.15% during the forecast period (2026-2031).
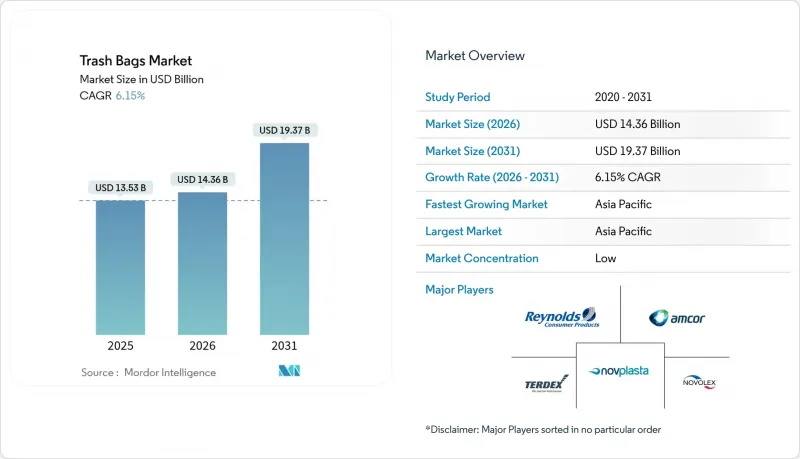
Rapid urbanization is swelling municipal solid-waste volumes, while pay-as-you-throw (PAYT) schemes and stricter producer-responsibility rules are redefining product specifications and boosting demand for premium, compliant liners. Asia-Pacific remains the largest regional consumer, benefitting from expanding middle-class populations and infrastructure upgrades. Mature markets in North America and Europe, pressured by single-use-plastic curbs, are accelerating shifts toward recycled and bio-based film grades. At the same time, volatile ethylene pricing continues to squeeze converter margins, reinforcing consolidation among producers.
Global Trash Bags Market Trends and Insights
High-Urban Waste Generation and Need for Seamless Collection
Municipal solid-waste volumes reached 2.1 billion t in 2023 and are on track for 3.8 billion t by 2050. Cities now specify puncture-resistant, uniform liners compatible with automated trucks, spurring growth of the trash bags market. IoT-enabled bins paired with AI route optimization have cut fuel use 28% and lifted collection efficiency 41.5% in pilot projects. These shifts increase demand for films that hold shape in high-heat climates and resist extended storage degradation.
Hygiene-Centric Consumer Behaviour Post-Pandemics
Hospitals diverted 264.1 million lb of waste from landfills in 2024, and 68% adopted sustainable purchasing rules, pushing institutional buyers toward antimicrobial, odor-neutralizing liners. Premium SKUs such as eggshell-infused EGU bags debuted in 2025 to capture this demand. Similar trends in hospitality are lifting average selling prices and underpinning the institutional segment's 9.67% CAGR.
Single-Use-Plastic Bans and Extended-Producer Responsibility
California's SB 54 compels a 25% cut in single-use plastics by 2032 and requires USD 500 million in annual cleanup funding. Similar mandates in British Columbia and the EU shift disposal costs to producers, forcing investments in recycled content and compostable alternatives. Compliance complexity elevates costs and limits access for low-margin suppliers, restraining near-term expansion of the trash bags market.
Other drivers and restraints analyzed in the detailed report include:
- Rise of PAYT Municipal Fee Models
- Expansion of Online Grocery Demanding Leak-Proof Liners
- Volatile Ethylene Prices Squeezing Converter Margins
For complete list of drivers and restraints, kindly check the Table Of Contents.
Segment Analysis
Institutional users-healthcare, hospitality and education-propelled 9.58% CAGR to 2031, even as the residential segment retained 63.78% of 2025 revenue. Hospitals' sustainable procurement policies and stricter infection-control protocols are driving demand for antimicrobial, leak-proof liners in the trash bags market. Institutional buyers value performance and compliance over price, supporting premium SKUs with recycled or bio-based content. Residential demand remains volume-driven, buoyed by PAYT programs and brand loyalty but constrained by price sensitivity.
The institutional upsurge encourages suppliers to refine spec-based offerings and secure multi-year contracts. At the same time, household buyers increasingly trade up to scented or reinforced bags, expanding average unit values. As city governments introduce differentiated collection streams, both user groups are turning to certified color-coded liners, further enlarging the trash bags market.
LDPE held the largest 38.41% trash bags market share in 2025 thanks to price and process familiarity. Yet bio-based plastics such as PLA and PHA are poised for 10.42% CAGR, catalyzed by corporate net-zero pledges and investments like NatureWorks' USD 350 million PLA plant in Thailand. Compostable grades still lag in humid tropics where degradation rates slow, but regulatory incentives are narrowing cost gaps. HDPE and LLDPE films, meanwhile, are integrating post-consumer resin to maintain market relevance.
Equipment upgrades and certification hurdles are tempering a swift material shift, yet rising landfill levies and EPR fees continue to erode the cost advantage of fossil-based resins. Suppliers that can merge circular content with mechanical strength are best positioned to capture the expanding trash bags market size for sustainable variants.
The Trash Bags Market Report is Segmented by End-User (Residential, Institutional, Commercial and Industrial), Material Type (HDPE, LDPE, LLDPE, Bio-based/Biodegradable Plastics), Capacity/Bag Size (Up To 10 Gallon, 13-30 Gallon, 30-55 Gallon, Above 55 Gallon), Sales Channel (Retail, B2B/Institutional Procurement, Distribution/Wholesale), and Geography. The Market Forecasts are Provided in Terms of Value (USD).
Geography Analysis
Asia-Pacific generated 40.32% of global revenue in 2025 and is on track for an 8.05% CAGR to 2031, driven by urban sprawl in China and India and widening middle-class consumption. AI-enabled sorting robots in South Korea and Japan are lifting recycled-HDPE availability, while tropical climates complicate compostable-bag deployment. Diverse national bans and recycling targets require flexible sourcing strategies for global suppliers.
North America's mature infrastructure is evolving under EPR legislation such as California's SB 54, prompting a pivot to recycled and bio-based liners. PAYT programs in 6,000 communities now dictate certified bag sizes, underpinning stable unit demand and supporting a higher-value mix. Premium innovations, including Glad's 2X stronger bags launched in April 2025, cater to hygiene-aware households.
Europe's circular-economy agenda is spurring aggressive recycled-content mandates. Germany's reuse pools and France's incoming deposit-return schemes exemplify region-wide momentum toward waste reduction. Packaging groups such as Saica Flex now market 100% recyclable films with minimum 5% PCR, consolidating Europe's position as a bellwether for sustainable standards.
- Amcor Plc
- Reynolds Consumer Products (Hefty)
- The Clorox Company (Glad)
- Novolex Holdings LLC
- Inteplast Group Ltd.
- Poly-America LP
- Pack-It BV
- Kemii Garbage Bag Co. Ltd.
- Cosmoplast Industrial Co. LLC
- Luban Packing LLC
- International Plastics Inc.
- Novplasta s.r.o.
- Terdex GmbH
- Simplehuman LLC
- Ruffies / Pactiv Evergreen
- WasteZero Inc.
- Al-Sinai Plastic Factory
- Abu Dawood Group (Pekoe)
- Thai Plastic Bag Industry Co. Ltd.
- Crown Poly Inc.
Additional Benefits:
- The market estimate (ME) sheet in Excel format
- 3 months of analyst support
TABLE OF CONTENTS
1 INTRODUCTION
- 1.1 Study Assumptions and Market Definition
- 1.2 Scope of the Study
2 RESEARCH METHODOLOGY
3 EXECUTIVE SUMMARY
4 MARKET LANDSCAPE
- 4.1 Market Overview
- 4.2 Market Drivers
- 4.2.1 High-urban waste generation and need for seamless collection
- 4.2.2 Hygiene-centric consumer behaviour post-pandemics
- 4.2.3 Rise of pay-as-you-throw (PAYT) municipal fee models
- 4.2.4 Expansion of on-line grocery demanding leak-proof liners
- 4.2.5 Bioplastic price parity with LDPE/LLDPE feedstocks
- 4.2.6 AI-enabled robotic sorters boosting recycled-HDPE supply
- 4.3 Market Restraints
- 4.3.1 Single-use-plastic bans and extended-producer?responsibility
- 4.3.2 Volatile ethylene prices squeezing converter margins
- 4.3.3 Compostable-bag performance gaps in humid climates
- 4.3.4 Growing refill/reuse station pilots in retail chains
- 4.4 Supply-Chain Analysis
- 4.5 Regulatory Landscape
- 4.6 Technological Outlook
- 4.7 Porter's Five Forces
- 4.7.1 Threat of New Entrants
- 4.7.2 Bargaining Power of Buyers
- 4.7.3 Bargaining Power of Suppliers
- 4.7.4 Threat of Substitutes
- 4.7.5 Competitive Rivalry
5 MARKET SIZE AND GROWTH FORECASTS (VALUE)
- 5.1 By End-user
- 5.1.1 Residential
- 5.1.2 Institutional (HoReCa, Healthcare, Education)
- 5.1.3 Commercial and Industrial
- 5.2 By Material Type
- 5.2.1 High-Density Polyethylene (HDPE)
- 5.2.2 Low-Density Polyethylene (LDPE)
- 5.2.3 Linear Low-Density Polyethylene (LLDPE)
- 5.2.4 Bio-based/Biodegradable Plastics (PLA, PBAT, PHA)
- 5.3 By Capacity / Bag Size
- 5.3.1 Up to 10 Gallon
- 5.3.2 13 - 30 Gallon
- 5.3.3 30 - 55 Gallon
- 5.3.4 Above 55 Gallon
- 5.4 By Sales Channel
- 5.4.1 Retail (Supermarkets, Convenience, Online)
- 5.4.2 B2B / Institutional Procurement
- 5.4.3 Distribution / Wholesale
- 5.5 By Geography
- 5.5.1 North America
- 5.5.1.1 United States
- 5.5.1.2 Canada
- 5.5.1.3 Mexico
- 5.5.2 Europe
- 5.5.2.1 Germany
- 5.5.2.2 United Kingdom
- 5.5.2.3 France
- 5.5.2.4 Italy
- 5.5.2.5 Spain
- 5.5.2.6 Russia
- 5.5.2.7 Rest of Europe
- 5.5.3 Asia-Pacific
- 5.5.3.1 China
- 5.5.3.2 India
- 5.5.3.3 Japan
- 5.5.3.4 South Korea
- 5.5.3.5 Australia and New Zealand
- 5.5.3.6 Rest of Asia-Pacific
- 5.5.4 Middle East and Africa
- 5.5.4.1 Middle East
- 5.5.4.1.1 United Arab Emirates
- 5.5.4.1.2 Saudi Arabia
- 5.5.4.1.3 Turkey
- 5.5.4.1.4 Rest of Middle East
- 5.5.4.2 Africa
- 5.5.4.2.1 South Africa
- 5.5.4.2.2 Nigeria
- 5.5.4.2.3 Egypt
- 5.5.4.2.4 Rest of Africa
- 5.5.4.1 Middle East
- 5.5.5 South America
- 5.5.5.1 Brazil
- 5.5.5.2 Argentina
- 5.5.5.3 Rest of South America
- 5.5.1 North America
6 COMPETITIVE LANDSCAPE
- 6.1 Market Concentration
- 6.2 Strategic Moves
- 6.3 Market Share Analysis
- 6.4 Company Profiles (includes Global level Overview, Market level overview, Core Segments, Financials as available, Strategic Information, Market Rank/Share for key companies, Products and Services, and Recent Developments)
- 6.4.1 Amcor Plc
- 6.4.2 Reynolds Consumer Products (Hefty)
- 6.4.3 The Clorox Company (Glad)
- 6.4.4 Novolex Holdings LLC
- 6.4.5 Inteplast Group Ltd.
- 6.4.6 Poly-America LP
- 6.4.7 Pack-It BV
- 6.4.8 Kemii Garbage Bag Co. Ltd.
- 6.4.9 Cosmoplast Industrial Co. LLC
- 6.4.10 Luban Packing LLC
- 6.4.11 International Plastics Inc.
- 6.4.12 Novplasta s.r.o.
- 6.4.13 Terdex GmbH
- 6.4.14 Simplehuman LLC
- 6.4.15 Ruffies / Pactiv Evergreen
- 6.4.16 WasteZero Inc.
- 6.4.17 Al-Sinai Plastic Factory
- 6.4.18 Abu Dawood Group (Pekoe)
- 6.4.19 Thai Plastic Bag Industry Co. Ltd.
- 6.4.20 Crown Poly Inc.
7 MARKET OPPORTUNITIES AND FUTURE OUTLOOK
- 7.1 White-space and Unmet-need Assessment

