
PUBLISHER: Mordor Intelligence | PRODUCT CODE: 1851993

PUBLISHER: Mordor Intelligence | PRODUCT CODE: 1851993
Armored Vehicles - Market Share Analysis, Industry Trends & Statistics, Growth Forecasts (2025 - 2030)
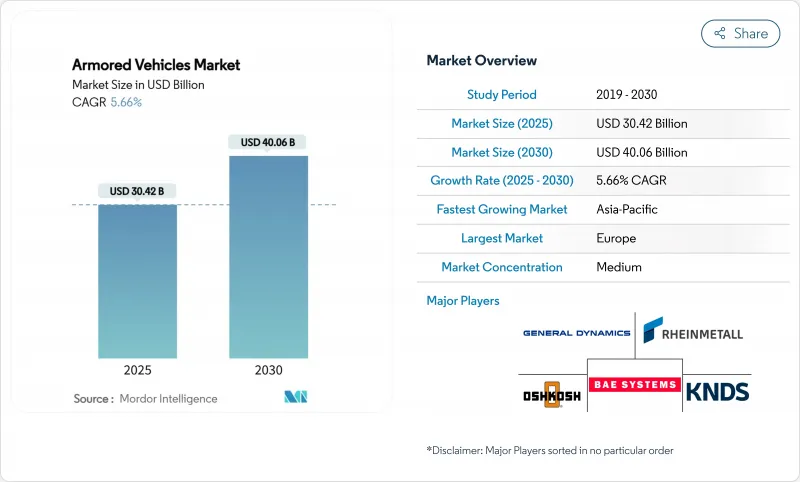
The armored vehicles market size reached USD 30.42 billion in 2025 and is forecast to register a 5.66% CAGR, lifting the value to USD 40.06 billion by 2030.
The demand uptrend reflects intensified recapitalization programs across NATO, elevated procurement in Asia-Pacific, and fast-rising interest in silent-watch electric variants that enhance survivability while lowering fuel burn. Germany's decision to order 8,500 new vehicles, Poland's rapid tank buys from South Korea, and India's Future Infantry Combat Vehicle requirement illustrate how governments are shortening acquisition timelines and favoring modular designs that can be fielded quickly. Competitive rivalry escalates as primes pursue mega-contracts, such as the USD 45 billion XM30 program, and bolt-on acquisitions that shore up US supply-chain access and active-protection know-how. Supply-side friction remains, however, with rare-earth and armor-ceramic shortages slowing line-rate increases and prompting Western governments to subsidize domestic forging capacity.
Global Armored Vehicles Market Trends and Insights
Rapid Recapitalization Programs in NATO and Asia
NATO members inject record funds into heavy-armor fleets, reversing three decades of drawdowns. Germany raised defense spending to 5% of GDP and placed multi-billion-dollar orders for Boxer and Patria vehicles that will reshape the European force structure. Poland directed USD 6.5 billion toward K2 tanks from South Korea to speed deliveries outside traditional Western channels. The Netherlands reactivated a tank battalion with 46 Leopard 2A8 units, highlighting how even former post-tank nations now regard tracked armor as indispensable. India's Future Ready Combat Vehicle call for 1,770 platforms in Asia and China's ongoing Type 99A upgrades signal parallel demand surges. The synchronized orders underpin a multi-year production boom that allows OEMs to amortize new welding halls, robotic paint lines, and modular digital-assembly tooling across global programs.
Elevated Land-Warfare Demand Post-Ukraine Conflict
The Ukraine war affirmed armored vehicles' centrality in peer warfare. Kyiv's need for 23,000 vehicles demonstrated extreme battlefield burn rates, forcing NATO planners to audit inventories and accelerate backfill orders. Survivability gaps became clear, driving retrofits such as the USD 37 million Iron Fist APS award for US Bradley fleets after combat validation. Once set at 10-15 years, procurement cycles are collapsing to 3-5 years, compelling primes to front-load production capacity and governments to accept incremental upgrades while full-rate lines ramp.
Ballooning Unit Costs and Stretched Defense Budgets
Modern armor platforms now cost well into eight figures. The M10 Booker price has climbed to USD 19 million per unit, while Germany's Leopard 2A8 buy totals EUR 2.9 billion (USD 3.35 billion) for 105 tanks, squeezing even affluent treasuries. The US Army's 2025 force-structure reset cancelled multiple vehicle lines and trimmed Stryker orders to cap spending. Smaller nations are extending service lives or sourcing surplus MRAPs, as Morocco did with 50 M-ATVs, bypassing new-build queues. Rising interest rates and inflation compound affordability concerns, forcing ministries to trade off between airpower, drones, and ground-force recapitalization.
Other drivers and restraints analyzed in the detailed report include:
- Wheeled 8X8 Platforms Favored for Expeditionary Operations
- Battlefield Electrification and Silent-Watch Capability
- Industrial Supply-Chain Chokepoints in Armor Ceramics
For complete list of drivers and restraints, kindly check the Table Of Contents.
Segment Analysis
IFVs generated 34.57% of the armored vehicles market in 2024 and remain the centerpiece assets in mechanized brigades. Their balance of troop-carry capacity and 30-50 mm cannons supports combined-arms tactics from Baltic forests to Indo-Pacific littorals. Nations are upgrading legacy fleets with situational-awareness suites and programmable airburst rounds that counter unmanned aerial targets. Supplier consolidation, such as Leonardo's takeover of Iveco Defence, is expected to streamline turret integration, steering the armored vehicle market toward a standard digital backbone.
APCs are expanding at a 7.24% CAGR, fueled by lessons from Ukraine that stress troop protection over firepower. Lightweight MRAP designs with V-hulls and blast-attenuating seats enter police special-operations arsenals, a spillover diversifying revenue beyond defense ministries. Main battle tanks (MBTs) see modernization rather than fleet growth, with active-protection kits and sensors extending platform relevance. Light reconnaissance vehicles capture niche demand for rapid-strike missions, integrating AI-powered crew aids that reduce operator workload.
Wheeled designs held 73.28% of the armored vehicles market share in 2024, a dominance rooted in their ability to self-deploy over paved networks without tank transporters. NATO rapid-reaction brigades favor 8X8 chassis that cruise at highway speeds while offering scalable armor packages. The design trend in the armored vehicle market emphasizes independent suspension, run-flat inserts, and central-tire inflation to navigate mixed terrains.
Tracked platforms, though smaller in number, are rebounding at an 8.95% CAGR as armies relearn the need for cross-country mobility and heavy frontal protection against tandem-warhead threats. Modern tracks use segmented rubber composite pads that boost road life while retaining off-road traction. The hybrid fielding of both mobility types allows commanders to tailor task forces, a flexibility that underpins future doctrine.
The Armored Vehicles Market Report is Segmented by Platform Type (Armored Personnel Carrier, Infantry Fighting Vehicle, Mine-Resistant Ambush-Protected, Main Battle Tank, and More), Mobility (Wheeled and Tracked), Propulsion (Conventional and Electric), End-User (Army, Marine/Naval Infantry, and More), and Geography (North America, Europe, Asia-Pacific, and More). The Market Forecasts are Provided in Terms of Value (USD).
Geography Analysis
Europe delivered 42.83% of the armored vehicles market revenue in 2024, driven by Germany's record Boxer and Patria orders and Nordic consortium buys. Eastern members allocate more than 3% of GDP to defense, channeling funds to tracked fleets that bolster Article 5 deterrence. Western states emphasize wheeled fleets for out-of-area deployments, blending strategic lift economy with urban maneuverability.
Asia-Pacific follows as the fastest climber at a 7.21% CAGR. India's Future Infantry Combat Vehicle tender for 1,750 units worth INR 600 billion (USD 7.2 billion) and China's Type 99A progressive upgrades energize regional integrators. Japan explores wheeled modular chassis to supplement its Type 10 tank fleet, and Australia pivots to Land 400 Phase 3, reinforcing its infantry close-combat edge.
North America maintains steady modernization budgets, anchored by the XM30 and JLTV A2 programs that insert AI mission cores and hybrid drivetrains. Canada backfills LAV 6.0 attrition losses with domestically produced variants, ensuring supply-chain sovereignty. Mexico invests in refurbished MRAPs for internal security, representing a small but steady aftermarket.
The Middle East allocatef USD 78 billion in Saudi defense outlays for 2025, including prospective AyM 2030 armored formations tailored for desert warfare. Gulf buyers favor high-power-to-weight ratios for dune mobility and active cooling kits. Africa remains opportunistic, sourcing surplus vehicles via US Excess Defense Articles and refurb projects.
- General Dynamics Corporation
- BAE Systems plc
- Rheinmetall AG
- KNDS N.V.
- Hanwha Systems Co., Ltd. (Hanwha Corporation)
- Oshkosh Corporation
- Textron Systems Corporation (Textron Inc.)
- Elbit Systems Ltd.
- Patria Group
- FNSS Savunma Sistemleri A.S.
- Otokar Otomotiv ve Savunma Sanayi A.S.
- Denel SOC Ltd.
- Saudi Arabian Military Industries
- Tata Advanced Systems Limited
- China North Industries Corporation (NORINCO)
- Singapore Technologies Engineering Ltd.
- Hyundai Rotem Company (Hyundai Motor Group)
- Mitsubishi Heavy Industries, Ltd.
- Paramount Group
- RTX Corporation
Additional Benefits:
- The market estimate (ME) sheet in Excel format
- 3 months of analyst support
TABLE OF CONTENTS
1 INTRODUCTION
- 1.1 Study Assumptions and Market Definition
- 1.2 Scope of the Study
2 RESEARCH METHODOLOGY
3 EXECUTIVE SUMMARY
4 MARKET LANDSCAPE
- 4.1 Market Overview
- 4.2 Market Drivers
- 4.2.1 Rapid recapitalization programs in NATO and Asia
- 4.2.2 Elevated land-warfare demand post-Ukraine conflict
- 4.2.3 Wheeled 8X8 platforms favored for expeditionary ops
- 4.2.4 Battlefield electrification and silent-watch capability
- 4.2.5 Modular active-protection system (APS) retrofits
- 4.2.6 IFV surge to modernize combined-arms doctrine
- 4.3 Market Restraints
- 4.3.1 Ballooning unit costs and stretched defense budgets
- 4.3.2 Industrial supply-chain chokepoints in armour ceramics
- 4.3.3 ESG pressure against heavy carbon-footprint fleets
- 4.3.4 Complex export-licensing/ITAR barriers
- 4.4 Value Chain Analysis
- 4.5 Regulatory Landscape
- 4.6 Technological Outlook
- 4.7 Porter's Five Forces Analysis
- 4.7.1 Threat of New Entrants
- 4.7.2 Bargaining Power of Buyers
- 4.7.3 Bargaining Power of Suppliers
- 4.7.4 Threat of Substitutes
- 4.7.5 Intensity of Competitive Rivalry
5 MARKET SIZE AND GROWTH FORECASTS (VALUE)
- 5.1 By Platform Type
- 5.1.1 Armored Personnel Carriers (APCs)
- 5.1.2 Infantry Fighting Vehicles (IFVs)
- 5.1.3 Mine-Resistant Ambush-Protected (MRAP)
- 5.1.4 Main Battle Tanks (MBTs)
- 5.1.5 Light Protected/Recon Vehicles
- 5.1.6 Others
- 5.2 By Mobility
- 5.2.1 Wheeled (4X4, 6X6, 8X8)
- 5.2.2 Tracked
- 5.3 By Propulsion
- 5.3.1 Conventional
- 5.3.2 Electric
- 5.4 By End-User
- 5.4.1 Army
- 5.4.2 Marine/Naval Infantry
- 5.4.3 Special Forces
- 5.4.4 Homeland Security
- 5.5 By Geography
- 5.5.1 North America
- 5.5.1.1 United States
- 5.5.1.2 Canada
- 5.5.1.3 Mexico
- 5.5.2 Europe
- 5.5.2.1 United Kingdom
- 5.5.2.2 France
- 5.5.2.3 Germany
- 5.5.2.4 Russia
- 5.5.2.5 Poland
- 5.5.2.6 Rest of Europe
- 5.5.3 Asia-Pacific
- 5.5.3.1 China
- 5.5.3.2 India
- 5.5.3.3 Japan
- 5.5.3.4 South Korea
- 5.5.3.5 Australia
- 5.5.3.6 Rest of Asia-Pacific
- 5.5.4 South America
- 5.5.4.1 Brazil
- 5.5.4.2 Rest of South America
- 5.5.5 Middle East and Africa
- 5.5.5.1 Middle East
- 5.5.5.1.1 Saudi Arabia
- 5.5.5.1.2 United Arab Emirates
- 5.5.5.1.3 Turkey
- 5.5.5.1.4 Rest of Middle East
- 5.5.5.2 Africa
- 5.5.5.2.1 South Africa
- 5.5.5.2.2 Rest of Africa
- 5.5.1 North America
6 COMPETITIVE LANDSCAPE
- 6.1 Market Concentration
- 6.2 Strategic Moves
- 6.3 Market Share Analysis
- 6.4 Company Profiles (includes Global level Overview, Market level overview, Core Segments, Financials as available, Strategic Information, Market Rank/Share for key companies, Products and Services, and Recent Developments)
- 6.4.1 General Dynamics Corporation
- 6.4.2 BAE Systems plc
- 6.4.3 Rheinmetall AG
- 6.4.4 KNDS N.V.
- 6.4.5 Hanwha Systems Co., Ltd. (Hanwha Corporation)
- 6.4.6 Oshkosh Corporation
- 6.4.7 Textron Systems Corporation (Textron Inc.)
- 6.4.8 Elbit Systems Ltd.
- 6.4.9 Patria Group
- 6.4.10 FNSS Savunma Sistemleri A.S.
- 6.4.11 Otokar Otomotiv ve Savunma Sanayi A.S.
- 6.4.12 Denel SOC Ltd.
- 6.4.13 Saudi Arabian Military Industries
- 6.4.14 Tata Advanced Systems Limited
- 6.4.15 China North Industries Corporation (NORINCO)
- 6.4.16 Singapore Technologies Engineering Ltd.
- 6.4.17 Hyundai Rotem Company (Hyundai Motor Group)
- 6.4.18 Mitsubishi Heavy Industries, Ltd.
- 6.4.19 Paramount Group
- 6.4.20 RTX Corporation
7 MARKET OPPORTUNITIES AND FUTURE OUTLOOK
- 7.1 White-space and Unmet-Need Assessment

