
PUBLISHER: Mordor Intelligence | PRODUCT CODE: 1852025

PUBLISHER: Mordor Intelligence | PRODUCT CODE: 1852025
Regenerative Medicine - Market Share Analysis, Industry Trends & Statistics, Growth Forecasts (2025 - 2030)
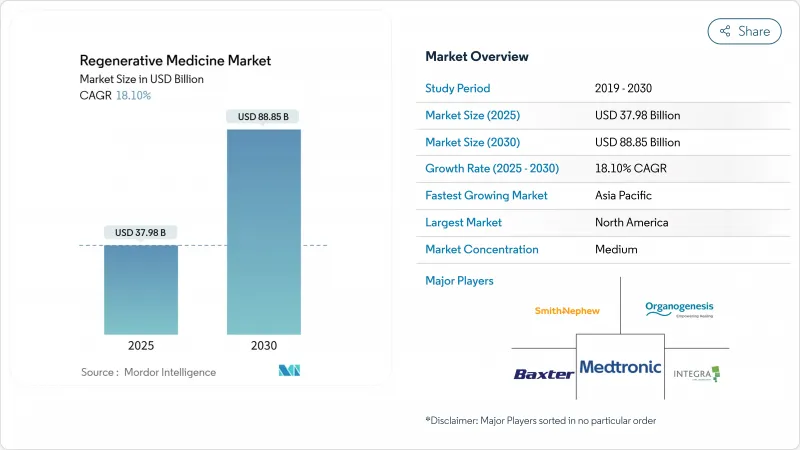
The Regenerative Medicine Market size is estimated at USD 37.98 billion in 2025, and is expected to reach USD 88.85 billion by 2030, at a CAGR of 18.10% during the forecast period (2025-2030).
Sustained funding for advanced cell and gene therapies, the success of expedited approval pathways, and strong investment in manufacturing infrastructure are lifting demand across nearly every therapeutic area. Gene-editing breakthroughs such as CRISPR Therapeutics' Casgevy are accelerating commercial uptake, while the allogeneic model is easing historical scale-up barriers that limited autologous approaches. Asia-Pacific's streamlined regulations and rising clinical-trial activity are positioning the region as a pivotal innovation hub. At the same time, reimbursement hurdles for high-cost autologous products are causing an uneven adoption curve that favors payors with deeper resources, prompting developers to explore outcomes-based agreements and other flexible payment models.
Global Regenerative Medicine Market Trends and Insights
Rapid Clinical Translation of Allogeneic Off-the-Shelf Cell Therapies
Allogeneic platforms are redefining scalability by replacing patient-specific manufacturing with standardized batches that can be cryopreserved and shipped as needed. These off-the-shelf constructs are gaining momentum as developers secure RMAT status that trims regulatory review cycles. In December 2024, the FDA granted RMAT designation to Affimed's acimtamig plus AlloNK regimen after an early 83.3% overall response rate, validating the model for hematologic oncology. Lower production costs, coupled with expanding GMP capacity, are allowing smaller firms to address niche indications that formerly lacked economic feasibility. As multi-donor iPSC platforms mature, the cost advantages of allogeneic production are expected to compress therapy pricing further and widen patient access.
Surge in Musculoskeletal Disorder Burden in Aging Populations Fueling Tissue-Engineered Implants
Growing life expectancy is swelling the prevalence of osteoarthritis, degenerative disc disease, and related conditions, spurring a 34.64% revenue share for orthopedics within the regenerative medicine market. Tissue-engineered implants offer durability and biologic integration superior to traditional prosthetics, yet commercialization hurdles such as bioburden control and cold-chain logistics persist. Companies, including Evonik, are mitigating these barriers through medical-grade polymers (RESOMER) and recombinant collagen (VECOLLAN) that improve bioprinting fidelity and storage stability. The convergence of advanced biomaterials and 3-D printing is enabling anatomic customisation for complex joint reconstructions. National health-system pilots in Japan and Germany are already demonstrating postoperative quality-of-life gains that could support broader reimbursement of tissue-engineered implants further shaping regenerative medicine market trends.
Limited Reimbursement Pathways for High-Cost Autologous Therapies
Price tags that can exceed USD 1 million per patient are colliding with budget-capped payor systems, curbing the speed at which autologous treatments penetrate routine care. Wealthier health networks in the United States and Western Europe have piloted outcomes-based contracts, yet broad adoption remains sporadic. Venture capital flows into tissue-engineered medical products have moderated as investors weigh reimbursement risk against long development timelines. While installment-payment and annuity models are gaining policy traction, the administrative complexity of tracking real-world outcomes continues to limit scalability. This financing uncertainty is amplifying interest in lower-cost allogeneic and gene-editing solutions, potentially reshaping the regenerative medicine market trajectory.
Other drivers and restraints analyzed in the detailed report include:
- Regenerative Medicine Advanced Therapy (RMAT) Designations Accelerating Approvals
- Increasing Adoption of Stem-Cell Technology in the Regenerative Medicine Market
- Stringent Japan PMDA Safety Monitoring Increasing Time-to-Market for Gene-Edited Constructs
For complete list of drivers and restraints, kindly check the Table Of Contents.
Segment Analysis
Gene therapies are rallying on a 25.39% CAGR that pushes the segment toward parity with cell therapies, which held 42.12% of regenerative medicine market share in 2024. The approval of Casgevy and the first prenatal spinal-muscular-atrophy intervention underscore gene-editing's expanding clinical reach. Developers are refining lipid nanoparticle and viral-vector delivery to improve tissue targeting and dose precision, while payors evaluate long-term cost offsets from potential cures. Regulatory guidance that clarifies potency assays and vector shedding studies is smoothing clinical progress across hematology, neurology, and rare metabolic conditions. Supply-chain investments, such as modular viral-vector suites, are poised to reduce bottlenecks as late-phase pipelines swell.
Momentum in gene editing is stimulating downstream demand for ancillary services, including bioinformatics, genomic char acterization, and long-read sequencing. Contract development organizations are scaling plasmid manufacturing to meet surging sponsor needs. As outcome data accrues, value-based pricing frameworks are expected to evolve, anchoring payment schedules on durability benchmarks over multi-year horizons. These shifts collectively fortify the regenerative medicine market against reimbursement headwinds and widen patient eligibility criteria.
Allogeneic products led with 55.14% revenue share of the regenerative medicine market in 2024, capitalizing on batch production that homogenizes quality and lowers per-dose cost. The difference in scale translates directly into shorter lead times for acute indications such as relapsed lymphoma, where delays in autologous manufacturing can be fatal. Multifunctional iPSC-derived T cells, already showing robust anti-myeloma activity, are positioned to amplify this trajectory once phase 1 biologic data matures.
Autologous approaches, however, maintain an edge in personalized tumor antigen recognition and currently post a solid 21.47% CAGR. Hybrid models-where patients receive an autologous starter dose followed by allogeneic consolidation-are under early investigation and could blur existing boundaries. Supply-chain resilience, including redundant donor pools and automated cell thawing units, remains pivotal for ensuring product consistency during rapid global deployment.
The Regenerative Medicine Market is Segmented by Product Type (Cell Therapies, Gene Therapies, and More), Origin of Cells (Autologous, and More), Source (Adult Stem Cells, and More), Application (Orthopedics and Musculoskeletal, and More), End User (Hospitals and More), and Geography (North America, Europe, Asia-Pacific, Middle East and Africa, South America). The Market Forecasts are Provided in Terms of Value (USD).
Geography Analysis
North America controlled 39.95% of the regenerative medicine market in 2024, leveraging an FDA structure that rewards breakthrough innovation. The RMAT pathway has already green-lit multiple first-in-class candidates, lowering perceived development risk and triggering substantial capital inflows. Novartis' USD 23 billion commitment to expand manufacturing in the United States, with seven new plants coming online, exemplifies how big pharma is cementing supply-chain sovereignty. Early-stage academic collaborations, such as Mayo Clinic's pediatric cardiac stem-cell program, continue to feed the clinical pipeline with high-impact indications. Persistent reimbursement disparities, however, create pockets of limited access even within a generally favorable environment.
Asia-Pacific is advancing at a 16.22% CAGR, propelled by Japan's adaptive licensing rules and China's 42% share of global industry-sponsored trials in 2023. Harmonization initiatives at China's NMPA are reducing redundant filings, allowing cross-border data leverage. Government-backed GMP hubs, typified by Wake Forest Institute for Regenerative Medicine's multi-organ program, are scaling manufacturing know-how that benefits smaller firms.Yet, infrastructural gaps in cold-chain logistics and quality-control analytics still restrain the pace at which therapies expand beyond tier-one cities.
Europe maintains a competitive foothold despite regulatory fragmentation. Germany hosts the highest concentration of regenerative-medicine companies, aided by a collaborative research culture and public-private funding schemes. The European Commission has begun drafting unified advanced-therapy guidelines, aiming to reduce case-by-case assessments that currently slow product launches ec.europa.eu. Innovative payment pilots, including milestone-based reimbursement in Italy for gene-therapy infusions, are helping reconcile clinical value with fiscal prudence. Cross-Atlantic alliances are on the rise, with EU firms licensing proprietary biomaterials to United States developers who provide late-stage trial expertise.
- GlaxoSmithKline
- Organogenesis
- Thermo Fisher Scientific
- Merck
- Beckton Dickinson
- Vertex Pharmaceuticals
- PolarityTE
- Abbvie
- Novartis
- Stryker
- Takeda Pharmaceuticals
- Astellas Pharma
- FUJIFILM
- MIMEDX Group
- Vericel
- Lineage Cell Therapeutics
- Mesoblast Ltd.
- Cynata Therapeutics Ltd.
- Gamida Cell Ltd.
- Pluristem Therapeutics
- Regenexx LLC
- Roche
- Bluebird bio Inc.
Additional Benefits:
- The market estimate (ME) sheet in Excel format
- 3 months of analyst support
TABLE OF CONTENTS
1 Introduction
- 1.1 Study Assumptions & Market Definition
- 1.2 Scope of the Study
2 Research Methodology
3 Executive Summary
4 Market Landscape
- 4.1 Market Overview
- 4.2 Market Drivers
- 4.2.1 Rapid Clinical Translation of Allogeneic Off-the-Shelf Cell Therapies
- 4.2.2 Surge in Musculoskeletal Disorder Burden in Aging Populations Fueling Tissue-Engineered Implants
- 4.2.3 Regenerative Medicine Advanced Therapy (RMAT) Designations Accelerating Approvals
- 4.2.4 Increasing Adoption of Stem Cell Technology
- 4.2.5 Government-Funded National Cell Manufacturing Hubs Scaling GMP Capacity
- 4.2.6 Integration of 3D Bioprinting with Biomaterial Scaffolds Driving Personalized Skin Substitutes
- 4.3 Market Restraints
- 4.3.1 Limited Reimbursement Pathways for High-Cost Autologous Therapies
- 4.3.2 Stringent Japan PMDA Safety Monitoring Increasing Time-to-Market for Gene-Edited Constructs
- 4.3.3 Low Physician Adoption Due to Handling Complexity of Cryopreserved Cell Therapies in Emerging Economies
- 4.3.4 Batch-to-Batch Variability in Stem-Cell Derived Products Hindering Commercial Scale-up
- 4.4 Regulatory Landscape
- 4.5 Porter's Five Forces Analysis
- 4.5.1 Threat of New Entrants
- 4.5.2 Bargaining Power of Buyers
- 4.5.3 Bargaining Power of Suppliers
- 4.5.4 Threat of Substitutes
- 4.5.5 Competitive Rivalry
5 Market Size & Growth Forecasts (Value in USD)
- 5.1 By Product Type
- 5.1.1 Cell Therapies
- 5.1.2 Gene Therapies
- 5.1.3 Tissue-Engineered Products
- 5.1.4 Biomaterials
- 5.1.5 Acellular Regenerative Products
- 5.2 By Origin of Cells
- 5.2.1 Autologous
- 5.2.2 Allogeneic
- 5.2.3 Xenogeneic
- 5.3 By Source
- 5.3.1 Adult Stem Cells
- 5.3.2 Induced Pluripotent Stem Cells
- 5.3.3 Embryonic Stem Cells
- 5.3.4 Hematopoietic Stem Cells
- 5.4 By Application
- 5.4.1 Orthopedics & Musculoskeletal
- 5.4.2 Dermatology & Wound Care
- 5.4.3 Cardiovascular
- 5.4.4 Neurology
- 5.4.5 Oncology
- 5.4.6 Ophthalmology
- 5.4.7 Others
- 5.5 By End User
- 5.5.1 Hospitals & Surgical Centers
- 5.5.2 Specialty Clinics
- 5.5.3 Academic & Research Institutes
- 5.5.4 Biobanks & Cell Banks
- 5.6 By Geography
- 5.6.1 North America
- 5.6.1.1 United States
- 5.6.1.2 Canada
- 5.6.1.3 Mexico
- 5.6.2 Europe
- 5.6.2.1 Germany
- 5.6.2.2 United Kingdom
- 5.6.2.3 France
- 5.6.2.4 Italy
- 5.6.2.5 Spain
- 5.6.2.6 Rest of Europe
- 5.6.3 Asia-Pacific
- 5.6.3.1 China
- 5.6.3.2 Japan
- 5.6.3.3 India
- 5.6.3.4 Australia
- 5.6.3.5 South Korea
- 5.6.3.6 Rest of Asia-Pacific
- 5.6.4 Middle East & Africa
- 5.6.4.1 GCC
- 5.6.4.2 South Africa
- 5.6.4.3 Rest of Middle East & Africa
- 5.6.5 South America
- 5.6.5.1 Brazil
- 5.6.5.2 Argentina
- 5.6.5.3 Rest of South America
- 5.6.1 North America
6 Competitive Landscape
- 6.1 Market Concentration
- 6.2 Market Share Analysis
- 6.3 Company Profiles (includes Global level Overview, Market level overview, Core Segments, Financials as available, Strategic Information, Market Rank/Share for key companies, Products & Services, and Recent Developments)
- 6.3.1 GSK plc
- 6.3.2 Organogenesis Holdings Inc.
- 6.3.3 Thermo Fisher Scientific Inc.
- 6.3.4 Merck KGaA
- 6.3.5 Becton, Dickinson and Company
- 6.3.6 Vertex Pharmaceuticals
- 6.3.7 PolarityTE Inc.
- 6.3.8 AbbVie Inc.
- 6.3.9 Novartis AG
- 6.3.10 Stryker Corp.
- 6.3.11 Takeda Pharmaceutical Co. Ltd.
- 6.3.12 Astellas Pharma Inc.
- 6.3.13 FUJIFILM Cellular Dynamics, Inc.
- 6.3.14 MiMedx Group, Inc.
- 6.3.15 Vericel Corp.
- 6.3.16 Lineage Cell Therapeutics
- 6.3.17 Mesoblast Ltd.
- 6.3.18 Cynata Therapeutics Ltd.
- 6.3.19 Gamida Cell Ltd.
- 6.3.20 Pluristem Therapeutics Inc.
- 6.3.21 Regenexx LLC
- 6.3.22 Roche Holding AG
- 6.3.23 Bluebird bio Inc.
7 Market Opportunities & Future Outlook
- 7.1 White-space & Unmet-Need Assessment

