
PUBLISHER: Mordor Intelligence | PRODUCT CODE: 1906047

PUBLISHER: Mordor Intelligence | PRODUCT CODE: 1906047
Medical Imaging - Market Share Analysis, Industry Trends & Statistics, Growth Forecasts (2026 - 2031)
Medical imaging market size in 2026 is estimated at USD 82.42 billion, growing from 2025 value of USD 78.90 billion with 2031 projections showing USD 102.56 billion, growing at 4.46% CAGR over 2026-2031.
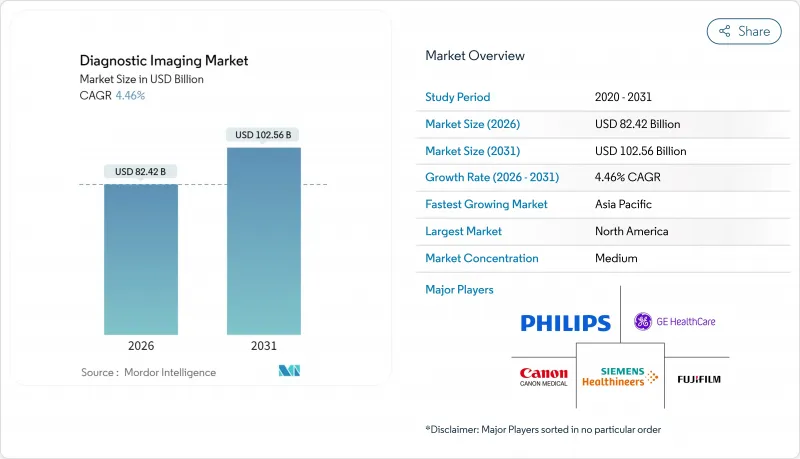
North America remains the largest revenue pool due to a dense installed base and capital budgets, while Asia-Pacific shows the strongest momentum as governments fund hospital capacity and domestic manufacturers scale price-competitive systems that expand access. X-ray continues to anchor high-volume use cases in emergency and orthopedic care, although computed tomography is gaining as faster scanners pair with AI-assisted detection and triage. Hospitals still lead because they can finance premium systems and link imaging to procedural services, yet outpatient imaging centers are taking share as payers steer site-of-service to lower-cost settings. Competitive dynamics reflect an oligopoly of multinational leaders that face price pressure from Chinese entrants and new demand pockets in mobile, handheld, and software-enabled workflows that change unit economics across the medical imaging market.
Global Medical Imaging Market Trends and Insights
Rise in Chronic Disease Prevalence Drives Imaging Demand
Chronic disease burden anchors sustained demand in the medical imaging market as cardiovascular disease, cancer, and diabetes require imaging for diagnosis, staging, and longitudinal monitoring across the care continuum. Cancer incidence is rising in many middle-income countries due to aging and lifestyle change, a trend that feeds CT and PET volumes within standardized oncology pathways. Cardiac CT and stress MRI have rolled into guideline-aligned care for coronary artery disease risk stratification, especially among adults with type 2 diabetes where surveillance protocols now emphasize noninvasive imaging in lieu of invasive diagnostics. Chronic kidney disease prevalence among older adults widens the role for non-contrast MRI and advanced sequences that avoid gadolinium exposure, which has accelerated software adoption for diffusion-weighted and arterial spin labeling protocols in the medical imaging market. Reimbursement policy is an important lever, since Medicare's Appropriate Use Criteria for advanced diagnostic imaging obliges decision-support integration that aligns clinical indications with modality selection and creates a defensible utilization record.
Growing Demand for Early and Accurate Diagnosis
The shift toward value-based contracts motivates health systems to detect disease earlier to avoid downstream costs, which expands the role of high-yield imaging in screening and diagnostic workups. Low-dose CT for lung cancer screening has a Grade B recommendation from the U.S. Preventive Services Task Force, and coverage decisions increased scan volumes as programs matured in community settings. State-level dense-breast legislation and the federal density reporting rule have broadened pathways for supplemental ultrasound or MRI in women with heterogeneously dense tissue, which drives demand for automated breast ultrasound and higher-throughput MRI suites in the medical imaging market. AI-enhanced triage that flags suspected intracranial hemorrhage or pulmonary embolism within minutes improves emergency department prioritization and supports more timely interventions, particularly in stroke pathways where every delay impacts outcomes. Compliance considerations include the need for robust validation of Software as a Medical Device across diverse datasets for FDA clearance, which affects release cadence and field performance in the medical imaging market.
High Cost of Advanced Imaging Equipment
Premium MRI and hybrid PET-MRI projects can require capital budgets above USD 3 million per unit, which restricts adoption outside tertiary centers. MRI rooms need RF shielding, structural reinforcement, and cryogen safety systems, which add siting expense beyond the scanner price. CT systems incorporate dose modulation and monitoring to align with ALARA expectations, increasing hardware and software costs for compliant deployments. Declining or flat per-scan reimbursement in hospital outpatient settings lengthens payback periods for new installations.
Other drivers and restraints analyzed in the detailed report include:
- Advancements in Imaging Technologies (AI, 3D, Hybrid Systems)
- Expansion of Healthcare Infrastructure in Emerging Economies
- Shortage of Skilled Radiologists And Technicians
For complete list of drivers and restraints, kindly check the Table Of Contents.
Segment Analysis
X-ray systems commanded 29.12% modality share in 2025, reflecting entrenched use in emergency and orthopedic workflows where low-cost digital radiography delivers fast answers with broad staff familiarity in the medical imaging market. Computed tomography is the fastest-moving modality at a 6.39% CAGR to 2031 based on multi-detector arrays, sub-second temporal resolution, and AI-aided workflow tools that cut review time and enhance detection sensitivity in high-volume settings. MRI retains a premium role in neuro and musculoskeletal imaging, though system pricing in the USD 2-3 million range and helium supply volatility push some procurement teams toward refurbished 1.5T systems in the medical imaging market. Ultrasound penetration expands with handheld devices that weigh under 500 grams and sell below USD 5,000, which puts point-of-care imaging in the hands of primary care and emergency teams that lacked immediate access to cart-based systems. Nuclear imaging remains tied to the radiopharmaceutical pipeline, with approvals like PSMA PET tracers widening indications in prostate oncology and influencing PET-CT utilization patterns in tertiary centers.
Fluoroscopy and mammography are mature replacement markets where digital upgrades are driven by quality and safety standards rather than rapid unit growth, guided by the Mammography Quality Standards Act framework and evolving density reporting rules. Hybrid platforms such as PET-CT and PET-MRI blend complementary strengths in oncology and neurology, though payer scrutiny of incremental value can temper adoption outside academic hubs in the medical imaging market. Vendors are shifting toward software-defined capabilities that unlock performance via subscriptions, including AI recon, spectral modes, and workflow orchestration that decouples feature adoption from full-hardware replacement. Photon-counting CT exemplifies this shift, as OEMs package spectral tools and dose advantages with service and software bundles for clearer ROI narratives. This mix supports stable value realization for providers and a durable installed base strategy for suppliers competing in the medical imaging market.
The Medical Imaging Market Report is Segmented by Modality (MRI, Computed Tomography, Ultrasound, X-Ray, and More), Application (Diagnostic, Therapeutic/Interventional, and Research & Clinical Trials), End User (Hospitals, and More), and Geography (North America, Europe, Asia-Pacific, Middle East & Africa, and South America). Market Forecasts are Provided in Terms of Value (USD).
Geography Analysis
North America held 41.95% share of the medical imaging market size in 2025 and remains the center of gravity for high-spec systems, enterprise imaging platforms, and AI-enabled workflows that align with established reimbursement structures. The United States accounts for the largest portion of global revenue due to capital budgets at scale and a large outpatient ecosystem that integrates imaging into routine care and complex procedures in the medical imaging market. Canada experiences wait-time constraints in some provinces that slow replacement cadences and stimulate public-private partnerships, factors that shape procurement timing and service models. FDA device oversight and CMS coverage decisions influence feature adoption timelines and clinical indications, which reinforces early uptake of software tools that pair with established hardware lines in the medical imaging market.
Europe shows mature demand with centralized tenders that compress margins yet offer multi-year volume visibility for modality refresh cycles in the medical imaging market. Germany and France maintain higher per-capita utilization than the United Kingdom, where budget constraints limit capital replacement and contribute to lower scanner density relative to continental peers. MDR implementation increased compliance workload and certification time for AI-rich software, which favors incumbents with deep regulatory teams and structured post-market surveillance programs in the medical imaging market. Private providers in Central and Eastern Europe invest to serve medical tourists from Western Europe, where pricing and wait-time differentials pull procedures to regional hubs with modern imaging suites.
Asia-Pacific is the fastest-growing region at a 5.54% CAGR as China, India, and Southeast Asia expand access through public investment and private-chain growth, with domestic manufacturers adding capacity and competitive price points in the medical imaging market. Japan behaves like a replacement market, while Australia and South Korea combine high technology adoption with smaller absolute volumes due to population size. Regulatory fragmentation across ASEAN requires market-by-market registration and reimbursement planning, which influences launch sequencing and partner selection for manufacturers in the medical imaging market. In the Middle East, sovereign investment in tertiary-care hubs drives premium imaging procurement as part of economic diversification agendas, while Sub-Saharan Africa remains underserved and relies on portable and refurbished solutions tailored to infrastructure realities. South America concentrates growth in Brazil, Mexico, and Colombia as urban private hospitals build imaging-led service lines, while public systems and rural areas extend access through mobile fleets and tele-reporting in the medical imaging market.
- Agfa-Gevaert
- Butterfly Network
- Canon
- Carestream Health
- CurveBeam AI
- Esaote
- FUJIFILM
- GE Healthcare
- Hologic
- Hyperfine
- Koning
- Konica Minolta Healthcare
- Koninklijke Philips
- Nanox (Nano-X Imaging)
- Samsung Group
- Mindray
- Shimadzu
- Siemens Healthineers
- SIUI (Shantou Institute of Ultrasonic Instruments)
- United Imaging Healthcare
- Neusoft Medical Systems
- Ziehm Imaging
Additional Benefits:
- The market estimate (ME) sheet in Excel format
- 3 months of analyst support
TABLE OF CONTENTS
1 Introduction
- 1.1 Study Assumptions & Market Definition
- 1.2 Scope of the Study
2 Research Methodology
3 Executive Summary
4 Market Landscape
- 4.1 Market Overview
- 4.2 Market Drivers
- 4.2.1 Rising Prevalence of Chronic Diseases
- 4.2.2 Growing Demand for Early and Accurate Diagnosis
- 4.2.3 Advancements in Imaging Technologies
- 4.2.4 Increasing Aging Population Worldwide
- 4.2.5 Expansion of Healthcare Infrastructure In Emerging Economies
- 4.2.6 Increasing Use of Minimally Invasive And Image-Guided Procedures
- 4.3 Market Restraints
- 4.3.1 High Cost of Advanced Imaging Equipment
- 4.3.2 Shortage of Skilled Radiologists And Technicians
- 4.3.3 Stringent Regulatory Approvals and Compliance Requirements
- 4.3.4 Risk of Radiation Exposure in Certain Modalities
- 4.4 Value / Supply-Chain Analysis
- 4.5 Regulatory Landscape
- 4.6 Technological Outlook
- 4.7 Porter's Five Forces Analysis
- 4.7.1 Threat of New Entrants
- 4.7.2 Bargaining Power of Buyers
- 4.7.3 Bargaining Power of Suppliers
- 4.7.4 Threat of Substitutes
- 4.7.5 Intensity of Competitive Rivalry
5 Market Size & Growth Forecasts (Value)
- 5.1 By Modality
- 5.1.1 MRI
- 5.1.1.1 Low & Mid-Field (<1.5 T)
- 5.1.1.2 High-Field (1.5-3 T)
- 5.1.1.3 Very-/Ultra-High-Field (>3 T)
- 5.1.2 Computed Tomography
- 5.1.2.1 Low-End (~16-slice)
- 5.1.2.2 Mid-Range (~64-slice)
- 5.1.2.3 High-End (>=128-slice)
- 5.1.3 Ultrasound
- 5.1.3.1 2-D
- 5.1.3.2 3-D/4-D
- 5.1.3.3 Hand-held/Portable
- 5.1.4 X-Ray
- 5.1.4.1 Analog Systems
- 5.1.4.2 Digital Radiography (CR/DR)
- 5.1.5 Nuclear Imaging
- 5.1.5.1 PET
- 5.1.5.2 SPECT
- 5.1.5.3 Hybrid PET/MRI - emerging
- 5.1.6 Fluoroscopy
- 5.1.7 Mammography
- 5.1.1 MRI
- 5.2 By Application
- 5.2.1 Diagnostic
- 5.2.2 Therapeutic / Interventional
- 5.2.3 Research & Clinical Trials
- 5.3 By End User
- 5.3.1 Hospitals
- 5.3.2 Diagnostic Imaging Centers
- 5.3.3 Academic & Research Institutes
- 5.3.4 Ambulatory Surgical Centers
- 5.3.5 Physician Offices & Outpatient Clinics
- 5.3.6 Mobile Imaging Providers
- 5.4 Geography
- 5.4.1 North America
- 5.4.1.1 United States
- 5.4.1.2 Canada
- 5.4.1.3 Mexico
- 5.4.2 Europe
- 5.4.2.1 Germany
- 5.4.2.2 United Kingdom
- 5.4.2.3 France
- 5.4.2.4 Italy
- 5.4.2.5 Spain
- 5.4.2.6 Rest of Europe
- 5.4.3 Asia-Pacific
- 5.4.3.1 China
- 5.4.3.2 Japan
- 5.4.3.3 India
- 5.4.3.4 Australia
- 5.4.3.5 South Korea
- 5.4.3.6 Rest of Asia-Pacific
- 5.4.4 Middle East & Africa
- 5.4.4.1 GCC
- 5.4.4.2 South Africa
- 5.4.4.3 Rest of Middle East & Africa
- 5.4.5 South America
- 5.4.5.1 Brazil
- 5.4.5.2 Argentina
- 5.4.5.3 Rest of South America
- 5.4.1 North America
6 Competitive Landscape
- 6.1 Market Concentration
- 6.2 Market Share Analysis
- 6.3 Company Profiles (includes Global level Overview, Market level overview, Core Segments, Financials as available, Strategic Information, Market Rank/Share for key companies, Products & Services, and Recent Developments)
- 6.3.1 Agfa-Gevaert Group
- 6.3.2 Butterfly Network
- 6.3.3 Canon Medical Systems Corporation
- 6.3.4 Carestream Health
- 6.3.5 CurveBeam AI
- 6.3.6 Esaote SpA
- 6.3.7 Fujifilm Holdings Corporation
- 6.3.8 GE HealthCare
- 6.3.9 Hologic Inc.
- 6.3.10 Hyperfine Inc.
- 6.3.11 Koning Corporation
- 6.3.12 Konica Minolta Healthcare
- 6.3.13 Koninklijke Philips N.V.
- 6.3.14 Nanox (Nano-X Imaging)
- 6.3.15 Samsung Medison
- 6.3.16 Shenzhen Mindray Bio-Medical Electronics Co., Ltd.
- 6.3.17 Shimadzu Corporation
- 6.3.18 Siemens Healthineers AG
- 6.3.19 SIUI (Shantou Institute of Ultrasonic Instruments)
- 6.3.20 United Imaging Healthcare
- 6.3.21 Neusoft Medical Systems
- 6.3.22 Ziehm Imaging
7 Market Opportunities & Future Outlook
- 7.1 White-space & Unmet-Need Assessment

