
PUBLISHER: Mordor Intelligence | PRODUCT CODE: 1906049

PUBLISHER: Mordor Intelligence | PRODUCT CODE: 1906049
NA Printed Signage - Market Share Analysis, Industry Trends & Statistics, Growth Forecasts (2026 - 2031)
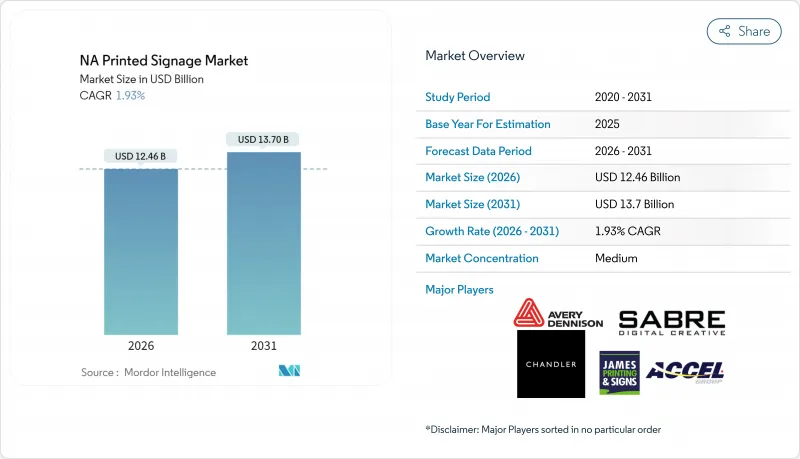
The North America printed signage market is expected to grow from USD 12.22 billion in 2025 to USD 12.46 billion in 2026 and is forecast to reach USD 13.7 billion by 2031 at 1.93% CAGR over 2026-2031.
Retail refresh cycles, sustainability mandates, and the rebound of out-of-home advertising are boosting baseline demand, even as digital screens compete for high-traffic locations. United States buyers account for 79.3% of regional demand through their expansive retail and transit footprints, while nearshoring inflows make Mexico the fastest-growing geography, growing at a 4.2% CAGR. Material preferences continue to split between PVC for its durability and paper for its recyclability, as six U.S. states enforce Extended Producer Responsibility laws. Sign makers, meanwhile, lean on UV-LED inkjet presses that cut energy use by about 70% and open up new substrate options, helping printed formats defend their total-cost-of-ownership advantages over digital displays.
NA Printed Signage Market Trends and Insights
Cost Effectiveness of Printed Signage
Printed graphics still deliver comparable visual impact at roughly one-tenth the lifecycle cost of a digital screen when campaigns last under six months. Franchise networks such as FASTSIGNS streamline design, production, and installation for small business owners, enabling rapid change-outs without capital commitments. UV-curable inks further extend outdoor life beyond three years, widening the savings gap against digital hardware that demands electricity, software, and maintenance. Low entry costs make printed banners the preferred choice for convenience stores, quick-service restaurants, and seasonal retailers that frequently refresh their messaging. The resulting cost moat keeps order volumes resilient even as economic cycles tighten budgets.
High Demand from the Retail Industry
Retailers allocate 15%-30% of their gross sales to in-store promotions, and printed signage remains the primary real-time price indicator. Variable-data workflows enable grocery and apparel chains to localize promotions in bilingual border markets, maintaining a 28.43% share of end-users in 2024. Airport concourses experienced a 21.4% revenue increase for advertising in 2024, indicating that premium travel corridors now support both printed and digital inventory. RFID-enabled smart labels and printed QR codes converge on the same substrates, knitting inventory visibility with shopper engagement while preserving the tactile impact of physical graphics.
Advent of Digital Signage
LED screens are eroding printed share in airports, malls, and quick-service chains, where daypart menus justify capital outlay. Lamar notes that converting a static board to digital boosts site revenue five to six times, steering budget toward pixels. Yet high acquisition cost, energy draw, and refresh limitations mean printed faces hold ground in secondary corridors and budget-sensitive retail. Sustainability audits now flag embedded carbon in electronics, giving recyclable posters a foothold in corporate ESG scorecards.
Other drivers and restraints analyzed in the detailed report include:
- Flexibility and Customization of Large-Format Printing Solutions
- Resurgence of Out-of-Home Advertising Post-Pandemic Recovery
- Rising Environmental Regulations on VOC Emissions from Solvent Inks
For complete list of drivers and restraints, kindly check the Table Of Contents.
Segment Analysis
PVC retains its 38.92% hold because billboards, vehicle wraps, and wayfinding in harsh climates require UV stability and multi-year durability. Fabric backdrops and metal composites fill event and high-end retail niches where tactile texture or metallic luster take precedence over cost. Adhesive innovations, such as Avery Dennison's CleanFlake, enable PET graphics to enter closed-loop recycling, signaling that even traditionally non-recyclable films are evolving. As converters qualify plasma-treated recycled papers that accept UV inks without mottling, the material mix will continue to tilt toward fiber-based substrates.
Paper and cardboard substrates are accounting for a growing share of the North America printed signage market as legislated recyclability goals in six U.S. states increase demand for FSC-certified grades. Their 4.38% CAGR through 2031 outpaces the overall market, driven by brand owners eager to showcase their sustainability credentials at the point of sale. Specialty papers made from bamboo or hemp reduce water use by 30% while maintaining tensile strength, broadening eligible applications from countertop displays to folded standees.
Banners, flags, and backdrops still account for 31.98% of product revenue in 2025, as portable event marketing relies on lightweight fabric systems. Billboards remain iconic in out-of-home advertising, but static faces are ceding ground where municipal codes allow digital conversions that increase the number of advertiser slots. Point-of-purchase displays straddle impulse conversion and brand storytelling inside retail aisles, integrating QR codes that funnel shoppers to loyalty apps. Product diversification is increasingly blending printed media with NFC or RFID tags, demonstrating that physical substrates can effectively anchor omnichannel journeys.
Backlit printed graphics are expanding at a 4.71% CAGR, fueled by LED modules that cut power draw by 70% and shorten payback to under 18 months in 24-hour venues. Airports, quick-service restaurants, and convenience stores value the high contrast and premium lease rates that illuminated frames secure, lifting revenue per square foot over non-lit posters.
The North America Printed Signage Market Report is Segmented by Material (Fabric and Textile, Metal Sheets and Foils, and More), Product (Billboards, Backlit Displays, and More), Application Type (Indoor, and Outdoor), End-User Vertical (Retail, BFSI, Sports and Leisure, and More), Printing Technology (Screen Printing, Inkjet Printing, and More), and Country. The Market Forecasts are Provided in Terms of Value (USD).
List of Companies Covered in this Report:
- Avery Dennison Corporation
- Sabre Digital Creative Inc.
- James Printing and Signs Inc.
- Kelly Signs Inc.
- Chandler Signs Holdings Inc.
- RGLA Solutions Inc.
- Accel Group Inc.
- AJ Printing and Graphics Inc.
- Southwest Printing Co.
- Vistaprint (Cimpress plc)
- FASTSIGNS International Inc.
- Signs Now (Alliance Franchise Brands LLC)
- Signarama (United Franchise Group)
- AlphaGraphics Inc.
- Image360 (Alliance Franchise Brands LLC)
- SpeedPro Imaging Inc.
- Lamar Advertising Company
- Clear Channel Outdoor Holdings Inc.
- Outfront Media Inc.
- Daktronics Inc.
Additional Benefits:
- The market estimate (ME) sheet in Excel format
- 3 months of analyst support
TABLE OF CONTENTS
1 INTRODUCTION
- 1.1 Study Assumptions and Market Definition
- 1.2 Scope of the Study
2 RESEARCH METHODOLOGY
3 EXECUTIVE SUMMARY
4 MARKET LANDSCAPE
- 4.1 Market Overview
- 4.2 Market Drivers
- 4.2.1 Cost Effectiveness of Printed Signage
- 4.2.2 High Demand from Retail Industry
- 4.2.3 Flexibility and Customization of Large-Format Printing Solutions
- 4.2.4 Resurgence of Out-of-Home Advertising Post-Pandemic Recovery
- 4.2.5 Sustainability Shift Toward Recyclable Substrates Accelerating Adoption
- 4.2.6 Integration of QR Codes Enabling Offline-to-Online Customer Journeys
- 4.3 Market Restraints
- 4.3.1 Advent of Digital Signage
- 4.3.2 Drawbacks of Screen Printing
- 4.3.3 Rising Environmental Regulations on VOC Emissions from Solvent Inks
- 4.3.4 Supply Chain Volatility in Specialty Substrates (Vinyl, UV-Coated Papers)
- 4.4 Industry Value Chain Analysis
- 4.5 Regulatory Landscape
- 4.6 Technological Outlook
- 4.7 Porter's Five Forces Analysis
- 4.7.1 Threat of New Entrants
- 4.7.2 Bargaining Power of Buyers or Consumers
- 4.7.3 Bargaining Power of Suppliers
- 4.7.4 Threat of Substitute Products
- 4.7.5 Intensity of Competitive Rivalry
- 4.8 Impact of Macroeconomic Factors on the Market
5 MARKET SIZE AND GROWTH FORECASTS (VALUE)
- 5.1 By Material
- 5.1.1 Paper and Cardboard
- 5.1.2 PVC and Plastic Composites
- 5.1.3 Fabric and Textile
- 5.1.4 Metal Sheets and Foils
- 5.1.5 Wood and Rigid Boards
- 5.2 By Product
- 5.2.1 Billboards
- 5.2.2 Backlit Displays
- 5.2.3 Point-of-Purchase (POP) Displays
- 5.2.4 Banners, Flags and Backdrops
- 5.2.5 Corporate Graphics, Exhibition and Trade-show Materials
- 5.2.6 Transit and Street Furniture
- 5.2.7 Other Products
- 5.3 By Application Type
- 5.3.1 Indoor Printed Signage
- 5.3.2 Outdoor Printed Signage
- 5.4 By End-user Vertical
- 5.4.1 Retail
- 5.4.2 BFSI
- 5.4.3 Transportation and Logistics
- 5.4.4 Sports and Leisure
- 5.4.5 Entertainment and Media
- 5.4.6 Education and Government
- 5.4.7 Other End-User Verticals
- 5.5 By Printing Technology
- 5.5.1 Screen Printing
- 5.5.2 Inkjet Printing
- 5.5.3 Toner-based (Electrophotography)
- 5.5.4 Other Printing Technologies
- 5.6 By Country
- 5.6.1 United States
- 5.6.2 Canada
- 5.6.3 Mexico
6 COMPETITIVE LANDSCAPE
- 6.1 Market Concentration
- 6.2 Strategic Moves
- 6.3 Market Share Analysis
- 6.4 Company Profiles (includes Global level Overview, Market level overview, Core Segments, Financials as available, Strategic Information, Market Rank or Share for key companies, Products and Services, and Recent Developments)
- 6.4.1 Avery Dennison Corporation
- 6.4.2 Sabre Digital Creative Inc.
- 6.4.3 James Printing and Signs Inc.
- 6.4.4 Kelly Signs Inc.
- 6.4.5 Chandler Signs Holdings Inc.
- 6.4.6 RGLA Solutions Inc.
- 6.4.7 Accel Group Inc.
- 6.4.8 AJ Printing and Graphics Inc.
- 6.4.9 Southwest Printing Co.
- 6.4.10 Vistaprint (Cimpress plc)
- 6.4.11 FASTSIGNS International Inc.
- 6.4.12 Signs Now (Alliance Franchise Brands LLC)
- 6.4.13 Signarama (United Franchise Group)
- 6.4.14 AlphaGraphics Inc.
- 6.4.15 Image360 (Alliance Franchise Brands LLC)
- 6.4.16 SpeedPro Imaging Inc.
- 6.4.17 Lamar Advertising Company
- 6.4.18 Clear Channel Outdoor Holdings Inc.
- 6.4.19 Outfront Media Inc.
- 6.4.20 Daktronics Inc.
7 MARKET OPPORTUNITIES AND FUTURE OUTLOOK
- 7.1 White-Space and Unmet-Need Assessment

