
PUBLISHER: Mordor Intelligence | PRODUCT CODE: 1906069

PUBLISHER: Mordor Intelligence | PRODUCT CODE: 1906069
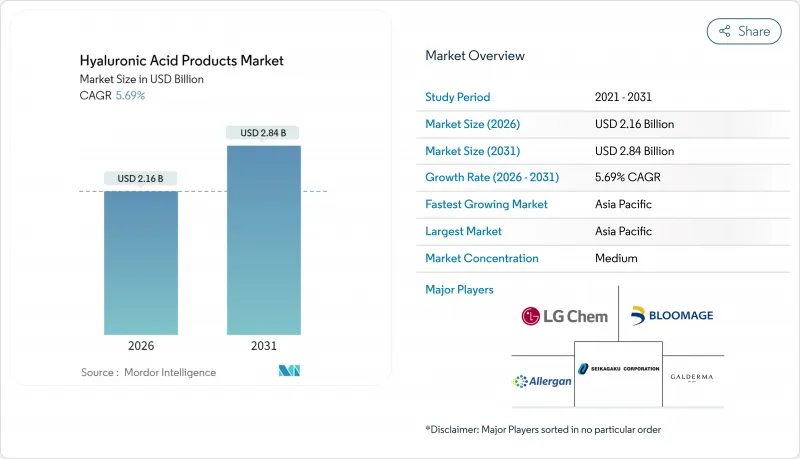
Hyaluronic Acid Products - Market Share Analysis, Industry Trends & Statistics, Growth Forecasts (2026 - 2031)
Hyaluronic Acid Products market size in 2026 is estimated at USD 2.16 billion, growing from 2025 value of USD 2.04 billion with 2031 projections showing USD 2.84 billion, growing at 5.69% CAGR over 2026-2031.
Young consumers, with their ingredient-first mindset, are driving momentum in the market. This shift reflects a growing preference for transparency and clean-label products, as consumers increasingly scrutinize product formulations. Regulatory approvals for food-grade applications and recent patent expiries, which broaden supplier options and foster competition, further fuel this trend. While facial care remains the dominant player due to its established consumer base, there's a noticeable surge in demand for hair-care products and ingestibles, driven by their perceived multifunctional benefits. Additionally, the adoption of minimally invasive dermal fillers in the medical realm is on the rise, supported by advancements in technology and growing awareness of aesthetic treatments. Across all categories, premium positioning is outpacing the overall Hyaluronic Acid Products market, as clinical validation leads consumers to prioritize efficacy over price. The distribution landscape is shifting online, with direct-to-consumer models enhancing both ingredient awareness and convenience for shoppers, offering them greater accessibility and personalized shopping experiences.
Global Hyaluronic Acid Products Market Trends and Insights
Skin-rejuvenation demand in Gen Z and millennials
In 2024, surveys reveal that 64% of shoppers trust the hydration claims of hyaluronic acid, surpassing the unprompted recall of retinol and vitamin C. Social media has elevated hyaluronic acid, making it a staple ingredient across all price tiers. This shift is driven by increased consumer awareness and education, as platforms like Instagram and TikTok amplify the benefits of hyaluronic acid through influencers and dermatologists. Brands are now highlighting molecular weight on front labels to align with transparency demands, as consumers seek detailed product information to make informed decisions. Firms investing in third-party testing are seeing lifted gross margins, thanks to a higher willingness among consumers to pay for clinically proven formulas. While regulatory frameworks in the U.S. and E.U. offer a compliance foundation, their differing enforcement practices influence product launch timings, with companies often tailoring strategies to navigate these regional variations effectively.
Rapid uptake of minimally invasive dermal fillers
In 2024, U.S. dermal-filler revenue saw hyaluronic acid commanding a dominant share, underscoring practitioners' preference for reversible and biocompatible materials due to their safety profile and adaptability. The "prejuvenation" trend is evident as patients aged 25-34 increasingly pursue preventive volumization to maintain youthful appearances and delay visible signs of aging. With cross-linked formulations now offering corrections lasting up to 18 months, clinics benefit from reduced visit frequency, improved patient satisfaction, and enhanced economics through optimized appointment scheduling. Established manufacturers find their foothold solidified by rigorous 510(k) pathways, which set a high bar for evidence, ensuring product efficacy and safety. Meanwhile, as Latin America and the Gulf states embrace these trends, the addressable market expands beyond its traditional Western confines, driven by rising aesthetic awareness and increasing disposable incomes in these regions.
Regulatory overhang on injectable adverse events
From 2015 to 2024, the FDA received over 5,500 reports of adverse events linked to hyaluronic acid fillers, with incidents ranging from vascular occlusion to vision loss. These adverse events have raised significant safety concerns, prompting the FDA to implement stricter regulatory measures. In response, the FDA now mandates detailed risk-mitigation plans and commitments to post-market surveillance prior to granting clearance, aiming to ensure better patient safety and product accountability. Under Europe's Medical Device Regulation, fillers are categorized as Class III, imposing stringent clinical trial and audit obligations to meet higher safety and efficacy standards. Since 2020, compliance costs have surged by 40% to 60%, elongating the time-to-market and giving an edge to established players who are better equipped to handle these financial and regulatory pressures. In light of rising malpractice premiums, some clinics are either narrowing their filler offerings or increasing prices to manage liability concerns, further impacting market dynamics and accessibility for consumers.
Other drivers and restraints analyzed in the detailed report include:
- Expiry of first-wave ha patents enabling low-cost entrants
- Food-grade HA approval in China and South-East Asia
- Substitution threat from polyglutamic acid in moisturizers
For complete list of drivers and restraints, kindly check the Table Of Contents.
Segment Analysis
In 2025, facial-care formulations command a dominant 81.63% share of the Hyaluronic Acid Products market. Industry standards see moisturizers boasting 1-2% sodium hyaluronate, while serums cater to the rising consumer demand for lightweight, multi-step skincare. Encapsulated microspheres are being adopted for their ability to deliver sustained hydration, justifying premium pricing. Clinical studies validate this trend, showcasing a notable 15% reduction in transepidermal water loss within just four weeks, bolstering consumer trust. Additionally, reformulating cleansers and toners with sub-0.5% hyaluronic acid effectively mitigates surfactant-induced dryness, enhancing the category's value through scientifically proven benefits.
Hair care is emerging as the fastest-growing segment in the Hyaluronic Acid Products market, with projections of a 7.18% CAGR from 2026 to 2031. By 2031, fueled by the increasing use of low-molecular-weight hyaluronic acid for follicle hydration and high-molecular-weight variants for smoothing cuticles. Leading K-beauty brands, including Shiseido and LG Household & Health Care, are rolling out scalp-serum boosters that blend hyaluronic acid with ceramides, targeting dryness and micro-inflammation. Specialty stores in Japan and South Korea are actively demonstrating product efficacy, particularly in enhancing strand elasticity. Innovations like leave-on scalp essences and pre-shampoo masks are broadening usage occasions and boosting average basket sizes.
The Hyaluronic Acid Products Market Report is Segmented by Type (Facial Care Products, Eye Care Products, and More), Category (Mass, Premium), Distribution Channel (Supermarkets/Hypermarkets, Specialty Stores, Online Retail Stores, Other Distribution Channel), and Geography (North America, Europe, Asia-Pacific, South America, Middle East and Africa). The Market Forecasts are Provided in Terms of Value (USD).
Geography Analysis
Asia-Pacific, commanding 41.10% of the revenue, leads with a robust 6.05% CAGR projected through 2031. China's nod to food-grade hyaluronic acid ignites a surge in ingestible beauty, while South Korea's exports bask in the glow of the K-beauty phenomenon. Japan, holding a 28.9% stake, bolsters viscosupplementation for knee osteoarthritis. Meanwhile, India and Australia emerge as promising growth arenas, albeit with tempered acceleration due to fragmented regulations and tariffs. Regional players like Bloomage Biotechnology harness scale and vertical integration, allowing them to outpace global counterparts on raw material pricing.
North America, riding on a well-established aesthetic infrastructure and robust consumer spending, follows closely. In the U.S., hyaluronic acid claims a dominant 58.8% share in fillers. However, heightened scrutiny over adverse events extends approval timelines and inflates compliance costs. While Canada and Mexico lag in per-capita consumption, urban hubs like Toronto and Mexico City signal potential growth. Europe, echoing North America's maturity, sees Germany, France, and the U.K. at the forefront of demand. Yet, the EU MDR regulations impose a heavier documentation burden, favoring multinationals. Post-Brexit, the U.K. grapples with regulatory divergence complicating logistics, though some relief comes from bilateral recognition easing specific filings.
In South America, Brazil leads the charge, driven by a cultural penchant for beauty treatments. However, Argentina's economic fluctuations temper its volume. In the Middle East, Saudi Arabia and the UAE position hyaluronic acid serums as luxury items, especially in duty-free markets. Africa's consumption is anchored in South Africa, yet challenges in affordability and distribution hinder rural access. While regulatory frameworks lag behind their Western counterparts, introducing market uncertainties, they simultaneously carve out opportunities for early entrants.
- Allergan (AbbVie)
- Galderma
- LG Chem
- Sanofi (Genzyme)
- Seikagaku Corporation
- Contipro
- Bloomage Biotechnology
- Shiseido
- Evonik Industries
- Smith & Nephew
- Zimmer Biomet
- Kewpie Corporation
- Anika Therapeutics
- Lubrizol Corporation
- Ashland Global
- HTL Biotechnology
- Fidia Farmaceutici
- Maruha Nichiro
- Medytox
- Altergon Italia
Additional Benefits:
- The market estimate (ME) sheet in Excel format
- 3 months of analyst support
TABLE OF CONTENTS
1 INTRODUCTION
- 1.1 Study Assumptions and Market Definition
- 1.2 Scope of the Study
2 RESEARCH METHODOLOGY
3 EXECUTIVE SUMMARY
4 MARKET LANDSCAPE
- 4.1 Market Overview
- 4.2 Market Drivers
- 4.2.1 Skin-rejuvenation demand in Gen-Z and Millennials
- 4.2.2 Rapid uptake of minimally-invasive dermal fillers
- 4.2.3 Expiry of first-wave HA patents enabling low-cost entrants
- 4.2.4 Food-grade HA approval in China and South-East Asia food and beverages
- 4.2.5 Medical-grade HA demand for viscosupplementation in aging knees
- 4.2.6 AI-enabled personalization of HA cosmetic regimens
- 4.3 Market Restraints
- 4.3.1 Pricing volatility of rooster comb-derived HA
- 4.3.2 Regulatory overhang on injectable adverse events
- 4.3.3 Supply-chain risk from fermentation-grade raw material shortages
- 4.3.4 Substitution threat from polyglutamic acid in moisturizers
- 4.4 Consumer Behaviour Analysis
- 4.5 Regulatory Landscape
- 4.6 Porter's Five Forces
- 4.6.1 Bargaining Power of Suppliers
- 4.6.2 Bargaining Power of Buyers
- 4.6.3 Threat of New Entrants
- 4.6.4 Threat of Substitutes
- 4.6.5 Competitive Rivalry
5 MARKET SIZE AND GROWTH FORECASTS (VALUE)
- 5.1 Type
- 5.1.1 Facial Care Products
- 5.1.1.1 Moisturizers and Creams
- 5.1.1.2 Facial Serum
- 5.1.1.3 Cleansers
- 5.1.1.4 Others
- 5.1.2 Eye Care Products
- 5.1.3 Lip Care Products
- 5.1.4 Hair Care Products
- 5.1.4.1 Shampoo and Conditioner
- 5.1.4.2 Others
- 5.1.5 Other Products
- 5.1.1 Facial Care Products
- 5.2 Category
- 5.2.1 Mass
- 5.2.2 Premium
- 5.3 Distribution Channel
- 5.3.1 Supermarkets/Hypermarkets
- 5.3.2 Specialty Stores
- 5.3.3 Online Retail Stores
- 5.3.4 Other Distribution Channel
- 5.4 Geography
- 5.4.1 North America
- 5.4.1.1 United States
- 5.4.1.2 Mexico
- 5.4.1.3 Canada
- 5.4.1.4 Rest of North America
- 5.4.2 Europe
- 5.4.2.1 United Kingdom
- 5.4.2.2 Germany
- 5.4.2.3 Spain
- 5.4.2.4 France
- 5.4.2.5 Italy
- 5.4.2.6 Netherlands
- 5.4.2.7 Rest of Europe
- 5.4.3 Asia-Pacific
- 5.4.3.1 China
- 5.4.3.2 India
- 5.4.3.3 Japan
- 5.4.3.4 Australia
- 5.4.3.5 Rest of Asia-Pacific
- 5.4.4 South America
- 5.4.4.1 Brazil
- 5.4.4.2 Argentina
- 5.4.4.3 Rest of South America
- 5.4.5 Middle East and Africa
- 5.4.5.1 Saudi Arabia
- 5.4.5.2 South Africa
- 5.4.5.3 Rest of Middle East and Africa
- 5.4.1 North America
6 COMPETITIVE LANDSCAPE
- 6.1 Market Concentration
- 6.2 Strategic Moves
- 6.3 Market Share Analysis
- 6.4 Company Profiles (includes Global level Overview, Market level overview, Core Segments, Financials as available, Strategic Information, Market Rank/Share for key companies, Products and Services, and Recent Developments)
- 6.4.1 Allergan (AbbVie)
- 6.4.2 Galderma
- 6.4.3 LG Chem
- 6.4.4 Sanofi (Genzyme)
- 6.4.5 Seikagaku Corporation
- 6.4.6 Contipro
- 6.4.7 Bloomage Biotechnology
- 6.4.8 Shiseido
- 6.4.9 Evonik Industries
- 6.4.10 Smith & Nephew
- 6.4.11 Zimmer Biomet
- 6.4.12 Kewpie Corporation
- 6.4.13 Anika Therapeutics
- 6.4.14 Lubrizol Corporation
- 6.4.15 Ashland Global
- 6.4.16 HTL Biotechnology
- 6.4.17 Fidia Farmaceutici
- 6.4.18 Maruha Nichiro
- 6.4.19 Medytox
- 6.4.20 Altergon Italia
7 MARKET OPPORTUNITIES AND FUTURE OUTLOOK

