
PUBLISHER: Mordor Intelligence | PRODUCT CODE: 1906104

PUBLISHER: Mordor Intelligence | PRODUCT CODE: 1906104
Paracetamol - Market Share Analysis, Industry Trends & Statistics, Growth Forecasts (2026 - 2031)
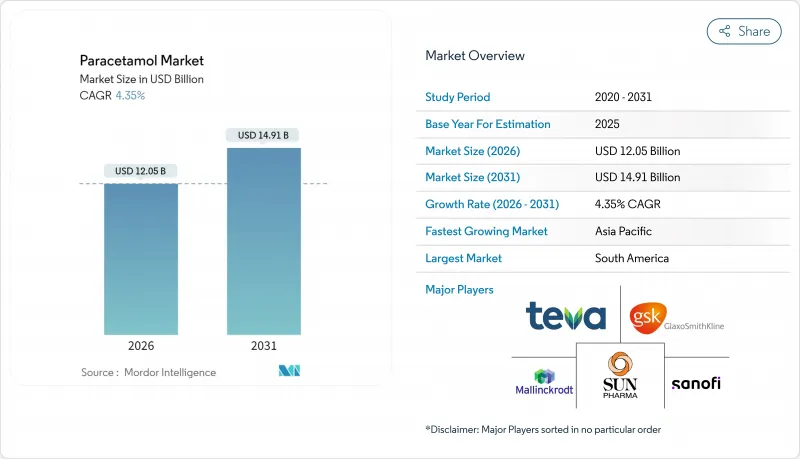
Paracetamol market size in 2026 is estimated at USD 12.05 billion, growing from 2025 value of USD 11.55 billion with 2031 projections showing USD 14.91 billion, growing at 4.35% CAGR over 2026-2031.
Demand resilience is underpinned by the drug's entrenched role as a first-line analgesic and antipyretic across all age groups, even as hepatotoxicity concerns spur tighter labeling rules in North America, Europe, and Australia. A gradual pivot away from China-centric active pharmaceutical ingredient (API) sourcing toward diversified Asian hubs is redefining supply security and cost structures, with India's China+1 strategy offering APIs at pricing about 20% lower than Chinese equivalents. Regulatory pack-size caps introduced in Australia in February 2025 signal a broader global trend toward dosage-harm mitigation. Meanwhile, digital pharmacy adoption is accelerating category growth as consumers prioritize doorstep delivery, data-driven medication management, and 24-hour access.
Global Paracetamol Market Trends and Insights
Rising Prevalence of Fever & Pain Indications
Global incidence of chronic pain and episodic fever keeps paracetamol demand buoyant. Around one quarter of the world's population now relies on the molecule for daily pain relief, giving it unmatched therapeutic reach. Unlike traditional NSAIDs, acetaminophen's mild COX-2 selectivity minimizes gastrointestinal and renal side effects, widening its use among elderly patients with comorbidities. Oncologists include it in multimodal cancer pain protocols to trim opioid requirements, decreasing dependence risks. As long-term safety hinges on a 4 g maximum daily dose, institutional stewardship programs monitor usage closely. With global populations aging, non-opioid pain strategies such as paracetamol remain pivotal in national treatment guidelines.
Growth in OTC Self-Medication Culture
North American and European consumers now average 26 pharmacy trips a year, far outpacing physician visits, underscoring an entrenched convenience ethos. U.S. OTC turnover surpassed USD 40 billion in 2024 and continues to climb, placing acetaminophen at the center of self-care regimens. In emerging economies, healthcare access gaps amplify reliance on OTC antipyretics. Yet safety trade-offs persist: in the U.S., acetaminophen overdoses drove more than 60,000 emergency visits and 500 fatalities last year. Manufacturers counter these risks via QR-based dosage tutorials, smarter blister packaging, and pharmacist-led counseling.
Hepatotoxicity-Driven Regulatory Dose Caps
Multiple agencies now enforce explicit dosage ceilings and tighter pack-sizes. Australia limited non-pharmacy packs to 16 tablets from February 2025. The U.S. FDA mandates boxed warnings on skin reactions and reminds prescribers not to exceed 3 g/day in chronic use. These measures curb unit volumes in retail channels and catalyze R&D into fixed-dose combinations that lower per-tablet payloads while sustaining efficacy. Brands invest in social-media campaigns promoting safe-use calculators and digital pill counters to guard consumer trust.
Other drivers and restraints analyzed in the detailed report include:
- Expansion of E-Commerce Pharmacy Channels
- Inclusion in National Essential-Medicine Lists
- Rising Adoption of NSAIDs & Combo Analgesics
For complete list of drivers and restraints, kindly check the Table Of Contents.
Segment Analysis
Injectables captured 4.65% compound annual growth prospects versus the low-single-digit trajectory for oral classes, signaling hospital demand for rapid antipyretic onset. Tablets nonetheless control 45.62% of 2025 revenues owing to ingrained consumer habits and low manufacturing cost. Producers hedge by rolling out orally disintegrating films and chewable minis to tap pediatric and geriatric cohorts seeking swallow-free intake. Contract manufacturers in India and Poland scale blister lines by 10-15% annually to meet sustained tablet replenishment cycles.
Supply-side innovation centers on film-casting technologies using pullulan and hydroxypropyl methylcellulose, yielding 73% drug release inside 10 minutes and trimming median disintegration times below 30 seconds. Suppositories remain a niche at <2% of volume, reserved for post-abdominal surgery or vomiting patients. Capsules cater to taste-averse consumers but face cannibalization from sugar-free suspension sachets popular in Southeast Asia. Across every dosage form, serialization mandates from the EU's Falsified Medicines Directive add unit-level traceability costs but enhance pharmacovigilance.
Fever applications deliver 38.25% of 2025 revenue, cementing paracetamol's role as the go-to antipyretic in pediatric protocols worldwide. Yet musculoskeletal accounts log the fastest CAGR at 4.73% as sedentary lifestyles and population aging elevate osteoarthritis prevalence. Analysts expect the paracetamol market share derived from chronic back-pain management to rise above 18.35% by 2031, supported by guidelines promoting non-opioid first-line therapy. Hospital formularies integrate round-the-clock intravenous acetaminophen to curtail post-arthroplasty opioid rescue dosing, enhancing patient throughput. Cold-and-flu formulations experience seasonal swings but benefit from combination SKUs bundling antihistamines and vitamin C.
Paracetamol's favorable gastrointestinal safety profile versus NSAIDs prompts rheumatologists to recommend sustained regimens for osteoarthritic knees and hips in elderly cohorts. Oncology centers adopt scheduled dosing to cut morphine burden in palliative care, aligning with WHO analgesic ladder principles. Headache indications keep traction through single-pill rapid-release tablets that clock median onset under 20 minutes, securing brand loyalty among migraine sufferers. Liquid suspensions fortified with child-friendly flavors continue propelling pediatric fever revenues, while global vaccine schedules maintain prophylactic use despite ongoing debates about immunogenicity interference.
The Report Covers Global Paracetamol Share & Industry Trends and It is Segmented by Dosage Form (Tablet, Capsules, Others), Application (Headache and Fever, Cold and Cough, Muscle Cramps, Others), and Geography (North America, Europe, Asia-Pacific, Middle East and Africa, and South America). The Report Offers the Value (in USD Million) for the Above Segments.
Geography Analysis
Asia-Pacific retained 34.05% paracetamol market share in 2025, powered by India's cost-competitive API output and robust domestic consumption. The nation's Production-Linked Incentive scheme catalyzes greenfield API parks with zero-duty capital goods, driving a double-digit rise in export consignments to Europe and Latin America. China's share declines modestly as multinational buyers diversify sourcing following new data-access stipulations, yet its scale keeps finished-dose output buoyant for domestic hospitals. Southeast Asia's expanding middle class lifts OTC sales, with Indonesia's e-commerce portals reporting 30% annual analgesic order growth.
South America leads growth at 4.52% CAGR through 2031, anchored by Brazil's USD 14.7 billion pharmaceutical spend and pro-generic policies. Local laboratories ramp tablet compression capacity to capture post-patent volumes as blockbuster expiries unlock USD 5-6 billion in addressable sales by 2028. Argentina's three-year plan to upgrade GMP lines targets chronic supply gaps in pediatric formulations, though macroeconomic volatility tempers near-term profitability. Chile and Colombia ease e-pharmacy rules, fostering regional cross-border fulfillment networks. North America preserves high per-capita consumption yet grapples with supply-chain vulnerabilities given that 72% of API plants supplying the U.S. sit offshore. The White House's 2025 National Drug-Supply Security blueprint earmarks tax credits for domestic acetaminophen API reactors expected online by 2028. Europe mirrors that reshoring thrust: France's Normandy project gains EUR 100 million state backing to slash dependency on Asian imports. Eastern European CDMOs capitalize on proximity to EU markets and lower labor costs to secure long-term supply contracts. The Middle East and Africa trail in share but register steady low-single-digit growth, buoyed by Gulf e-commerce expansion and African Union pooled procurement programs placing bulk tenders for pediatric syrups.
- Johnson & Johnson
- GlaxoSmithKline
- Sanofi
- Mallinckrodt Pharmaceuticals
- Granules India Ltd
- Teva Pharmaceutical Industries
- Sun Pharmaceuticals Industries
- Cipla
- Novartis
- Perrigo Company
- Strides Pharma Science Ltd
- Bayer
- Farmson Pharmaceutical Gujarat Pvt Ltd
- Anqiu Lu'an Pharmaceutical Co., Ltd
- Zhejiang Kangle Pharmaceutical Co., Ltd
- Hebei Jingye Pharmaceutical Co., Ltd
- Dr. Reddy's Laboratories Ltd
- Alkem Laboratories
- Lupin
Additional Benefits:
- The market estimate (ME) sheet in Excel format
- 3 months of analyst support
TABLE OF CONTENTS
1 Introduction
- 1.1 Study Assumptions & Market Definition
- 1.2 Scope of the Study
2 Research Methodology
3 Executive Summary
4 Market Landscape
- 4.1 Market Overview
- 4.2 Market Drivers
- 4.2.1 Rising prevalence of fever & pain indications
- 4.2.2 Growth in OTC self-medication culture
- 4.2.3 Expansion of e-commerce pharmacy channels
- 4.2.4 Inclusion in national essential-medicine lists
- 4.2.5 Pediatric-focused chewable / fast-dissolve formats
- 4.2.6 API capacity shift to low-cost Asian clusters
- 4.3 Market Restraints
- 4.3.1 Hepatotoxicity-driven regulatory dose caps
- 4.3.2 Rising adoption of NSAIDs & combo analgesics
- 4.3.3 Supply-chain risk from China-centric APIs
- 4.3.4 Pipeline of novel safer analgesics
- 4.4 Value / Supply-Chain Analysis
- 4.5 Regulatory Landscape
- 4.6 Technological Outlook
- 4.7 Porter's Five Forces
- 4.7.1 Bargaining Power of Suppliers
- 4.7.2 Bargaining Power of Buyers
- 4.7.3 Threat of New Entrants
- 4.7.4 Threat of Substitutes
- 4.7.5 Competitive Rivalry
5 Market Size & Growth Forecasts (Value, USD)
- 5.1 By Form
- 5.1.1 Tablets
- 5.1.2 Capsules
- 5.1.3 Liquid Suspension
- 5.1.4 Suppository
- 5.1.5 Injectable
- 5.2 By Application
- 5.2.1 Fever
- 5.2.2 Headache
- 5.2.3 Musculoskeletal Pain
- 5.2.4 Cold & Flu
- 5.2.5 Others
- 5.3 By Form
- 5.3.1 Combination Products
- 5.3.2 Single Products
- 5.4 By End-user
- 5.4.1 Hospitals & Clinics
- 5.4.2 Households
- 5.4.3 Others
- 5.5 By Dosage Strength
- 5.5.1 less than 325 mg
- 5.5.2 500 mg
- 5.5.3 More than 500 mg
- 5.6 By Region
- 5.6.1 North America
- 5.6.1.1 United States
- 5.6.1.2 Canada
- 5.6.1.3 Mexico
- 5.6.2 Europe
- 5.6.2.1 Germany
- 5.6.2.2 United Kingdom
- 5.6.2.3 France
- 5.6.2.4 Italy
- 5.6.2.5 Spain
- 5.6.2.6 Rest of Europe
- 5.6.3 Asia-Pacific
- 5.6.3.1 China
- 5.6.3.2 India
- 5.6.3.3 Japan
- 5.6.3.4 South Korea
- 5.6.3.5 Australia
- 5.6.3.6 Rest of Asia-Pacific
- 5.6.4 South America
- 5.6.4.1 Brazil
- 5.6.4.2 Argentina
- 5.6.4.3 Rest of South America
- 5.6.5 Middle East and Africa
- 5.6.5.1 GCC
- 5.6.5.2 South Africa
- 5.6.5.3 Rest of Middle East and Africa
- 5.6.1 North America
6 Competitive Landscape
- 6.1 Market Concentration
- 6.2 Market Share Analysis
- 6.3 Company Profiles (includes Global level Overview, Market level overview, Core Segments, Financials as available, Strategic Information, Market Rank/Share, Products & Services, Recent Developments)
- 6.3.1 Johnson & Johnson
- 6.3.2 GlaxoSmithKline plc
- 6.3.3 Sanofi SA
- 6.3.4 Mallinckrodt Pharmaceuticals
- 6.3.5 Granules India Ltd
- 6.3.6 Teva Pharmaceutical Industries Ltd
- 6.3.7 Sun Pharmaceutical Industries Ltd
- 6.3.8 Cipla Ltd
- 6.3.9 Novartis AG
- 6.3.10 Perrigo Company plc
- 6.3.11 Strides Pharma Science Ltd
- 6.3.12 Bayer AG
- 6.3.13 Farmson Pharmaceutical Gujarat Pvt Ltd
- 6.3.14 Anqiu Lu'an Pharmaceutical Co., Ltd
- 6.3.15 Zhejiang Kangle Pharmaceutical Co., Ltd
- 6.3.16 Hebei Jingye Pharmaceutical Co., Ltd
- 6.3.17 Dr. Reddy's Laboratories Ltd
- 6.3.18 Alkem Laboratories Ltd
- 6.3.19 Lupin Ltd
7 Market Opportunities & Future Outlook
- 7.1 White-space & Unmet-Need Assessment

