
PUBLISHER: Mordor Intelligence | PRODUCT CODE: 1906110

PUBLISHER: Mordor Intelligence | PRODUCT CODE: 1906110
Online Accommodation Booking - Market Share Analysis, Industry Trends & Statistics, Growth Forecasts (2026 - 2031)
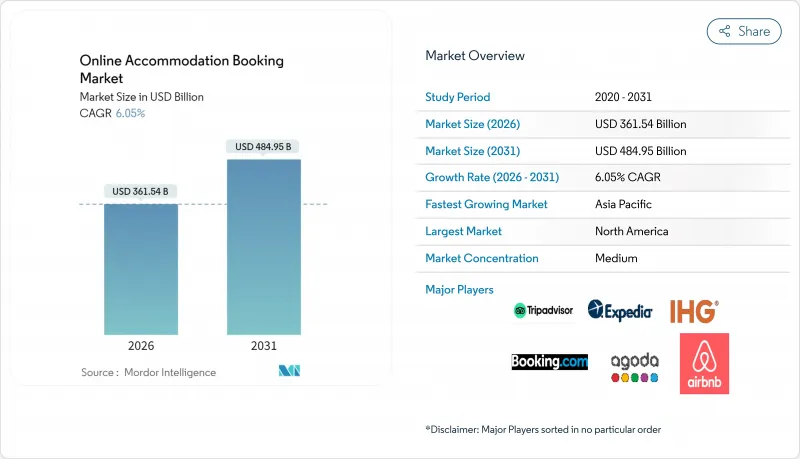
The online accommodation booking market was valued at USD 340.92 billion in 2025 and estimated to grow from USD 361.54 billion in 2026 to reach USD 484.95 billion by 2031, at a CAGR of 6.05% during the forecast period (2026-2031).
This expansion illustrates the sector's ability to adapt to changing traveler behavior that increasingly favors real-time booking and friction-free digital journeys. Rising smartphone penetration, faster mobile networks, and intuitive interfaces are moving bookings away from desktops and toward mobile-first experiences that reduce search time and improve conversion rates. Operators are matching this shift with AI-driven personalization tools that analyze browsing history, trip intent, and contextual signals to surface relevant properties faster than manual filters can. Competitive intensity is prompting major platforms to build proprietary models that recommend entire itineraries instead of only listing rooms, thereby elevating the perceived value of an integrated trip planner. Simultaneously, supply-side partners are adopting dynamic pricing engines that synchronize with these AI systems to protect margins while keeping inventory visible across multiple channels.
Global Online Accommodation Booking Market Trends and Insights
Rising Mobile Internet Penetration
Rapid 5G rollout and lower data tariffs are fostering uninterrupted, high-speed browsing that supports full-funnel trip planning on handheld devices. Travelers are leveraging biometric logins, digital wallets, and one-click checkout flows that significantly shorten the booking path and reduce abandonment. Mobile channels already account for more than six out of every ten online reservations, and their share keeps climbing because broadband connectivity reaches new rural and peri-urban users every quarter. Hospitality brands are responding by embedding chatbots, AR-enabled room previews, and real-time inventory alerts that capitalize on push-notification immediacy. These upgrades collectively raise app engagement, session depth, and booking frequency, cementing mobile's primacy in the customer journey. Providers unable to deliver seamless, low-latency mobile experiences risk marginalization as consumer expectations rise.
Growing Millennial & Gen-Z Travel Spend
Younger cohorts prioritize experience-rich travel over asset accumulation, and they value platforms that curate sustainable stays, authentic local touchpoints, and transparent pricing. Surveys conducted in 2024 showed that 41% of respondents wanted AI-generated itineraries tailored to personal interests, indicating demand for planning that goes beyond room selection. This shift is propelling vacation rentals and designer hostels, which promise community, flexibility, and shareable moments that align with social-media culture. Hotel groups are countering with hybrid accommodation concepts, such as micro-room urban properties featuring co-working lounges and self-service kitchens, to stay relevant to digital natives. Gamified loyalty programs are also gaining traction because they reward frequent micro-trips rather than only high-value stays, which fits the travel patterns of younger consumers. As disposable income rises among these demographics, their expectations continue to reshape industry norms around personalization, sustainability, and digital convenience.
Rising Regulatory Scrutiny on Short-Term Rentals
City councils across tourist hubs are imposing license caps, zoning rules, and nighttime limits to rebalance housing markets strained by vacation rentals. Platforms must invest in compliance dashboards that verify host eligibility, collect local taxes, and supply transparency reports on listing density. Non-compliant inventory faces delisting, shrinking available stock, and driving room rates upward during peak periods. Traditional hotels often obtain an advantage because they already comply with safety, accessibility, and taxation norms, whereas smaller hosts struggle to navigate new rules. Platforms that automate registration and facilitate tax remittance help retain supply, yet they incur additional development and operational expenses. Over time, stricter oversight could nudge travelers back toward regulated lodging formats, moderating the explosive growth of peer-to-peer rentals.
Other drivers and restraints analyzed in the detailed report include:
- Expansion of Low-Cost Carriers Boosting Short-Haul Trips
- AI-Powered Hyper-Personalized Search & Recommendation Engines
- High Customer-Acquisition Costs Compressing OTA Margins
For complete list of drivers and restraints, kindly check the Table Of Contents.
Segment Analysis
Mobile channels accounted for 61.45% of the online accommodation booking market share in 2025, a proportion that continues to widen as smartphone users expect one-handed search, voice input, and biometric payment verification. These apps compress the discover-research-book cycle into a few taps, which directly improves conversion while gathering high-quality behavior data for AI models. Push notifications remind travelers of price changes, loyalty milestones, and check-in details, thereby deepening engagement and encouraging repeat use. The online accommodation booking market size accruing to web browsers remains sizable, yet its growth trails mobile, especially among digital natives who consider laptops optional for travel planning. Established OTAs are restructuring product roadmaps to favor app-only features, such as mobile-exclusive discounts and AR room previews, to migrate reluctant desktop users. Independent hotels are following suit with white-label apps that sync room keys and in-stay messaging, narrowing the functionality gap with aggregator platforms.
Loyalty ecosystems now emphasize in-app gamification, awarding badges for consecutive bookings, off-peak travel, or eco-friendly property choices that resonate with younger travelers. Real-time location services allow apps to suggest nearby attractions, rideshares, or dining offers, extending value beyond the accommodation transaction itself. This ancillary focus increases average revenue per user while positioning the platform as a holistic trip companion instead of a one-off reservation tool. Super-apps in Asia-Pacific exemplify the potential, bundling flights, stay options, digital wallets, and food delivery in a single interface that streamlines vacation logistics. Western competitors observe these models closely, experimenting with partner APIs that insert add-on services without overhauling core infrastructure. App store ratings and review management, therefore, emerge as critical brand assets because they heavily influence organic installs and search ranking.
The Online Accommodation Booking Market Report is Segmented by Platform (Mobile Application, Website), Mode of Booking (Third-Party Online Portals, Direct/Captive Portals), Property Type (Hotels & Resorts, Vacation Rentals, Hostels & Budget Accommodations, Alternate Lodgings), and Geography (North America, South America, Europe, Asia-Pacific, Middle East and Africa). The Market Forecasts are Provided in Terms of Value (USD).
Geography Analysis
Asia-Pacific surpassed North America in booking volume growth, posting a 12.1% regional CAGR that far outpaces mature Western markets. Expanding middle-class disposable income, rapid airport infrastructure additions, and widespread mobile payment adoption are driving this momentum. Low-cost carriers add intra-regional routes weekly, stimulating spontaneous domestic and short-haul travel that fills city-center hotels and coastal resorts. Super-apps combine ride-hailing, payment wallets, and hotel inventory, lowering entry barriers for first-time digital bookers and elevating the importance of localized UX design. Government visa-facilitation policies, such as e-Visa schemes and simplified arrival procedures, further lubricate cross-border demand within Southeast Asia and beyond. As international chains roll out conversion-friendly localized websites, they strive to capture rising outbound traffic from India and mainland China, where regulatory clarity improves but still poses occasional bottlenecks on data localization and payment flows.
Europe still maintains the largest regional slice at 33.05% of global revenue due to a dense concentration of tourist attractions, high penetration of direct train connections, and strong legacy brand presence. However, stricter rental regulations in cities like Amsterdam and Barcelona temper short-term rental growth, nudging supply toward licensed hotels. Consumers benefit from multi-currency wallets and EU-wide payment harmonization that simplify cross-border bookings within the Schengen area. OTAs exploit this integration by bundling rail passes and attraction tickets, generating incremental revenue streams beyond accommodation itself. Political pressures on overtourism lead to visitor caps and dynamic taxation in famous locales, prompting travelers to explore secondary cities that now feature prominently in search results. Such dispersion broadens geographic coverage for platforms, though it also demands finer-grained inventory onboarding in emerging destinations.
North America, with a 27.62% share, exemplifies a market where digital channels already saturate the travel funnel, so incremental growth hinges on experiential upsells and value-added bundles rather than raw customer acquisition. U.S. consumers show a strong affinity for loyalty ecosystems that unify flights, stays, and co-branded credit-card rewards. Canadian provincial initiatives that market off-season wilderness experiences foster cross-border traffic, encouraging hotels to collaborate with outdoor excursion partners and display packaged offers online. Caribbean resort operators adopt advanced revenue-management platforms to compete with cruise lines for vacation budgets, accelerating digital transformation among all-inclusive properties. Mexico's integration into North American flight networks brings new feeder markets while inviting closer scrutiny of safety and tax compliance standards on vacation rentals. Taken together, these factors sustain a healthy but competitive environment where personalization and tiered loyalty benefits become decisive in share gains.
List of Companies Covered in this Report:
- Booking Holdings Inc.
- Expedia Group Inc.
- Airbnb Inc.
- Trip.com Group Ltd.
- Agoda Company Pte. Ltd.
- MakeMyTrip Ltd.
- Trivago N.V.
- OYO Rooms
- Hopper Inc.
- eDreams ODIGEO
- Despegar.com Corp.
- Tujia.com
- Rakuten Travel
- Hotels.com
- Marriott International (Direct)
- Hilton Worldwide Holdings (Direct)
- Accor S.A.
- InterContinental Hotels Group PLC
- Priceline.com
Additional Benefits:
- The market estimate (ME) sheet in Excel format
- 3 months of analyst support
TABLE OF CONTENTS
1 Introduction
- 1.1 Study Assumptions & Market Definition
- 1.2 Scope of the Study
2 Research Methodology
3 Executive Summary
4 Market Landscape
- 4.1 Market Overview
- 4.2 Market Drivers
- 4.2.1 Rising mobile internet penetration
- 4.2.2 Growing millennial & Gen-Z travel spend
- 4.2.3 Expansion of low-cost carriers boosting short-haul trips
- 4.2.4 Loyalty-linked dynamic pricing by OTAs
- 4.2.5 ESG-driven preference for certified sustainable stays (under-reported)
- 4.2.6 AI-powered hyper-personalised search & recommendation engines (under-reported)
- 4.3 Market Restraints
- 4.3.1 Rising regulatory scrutiny on short-term rentals
- 4.3.2 High customer-acquisition costs compressing OTA margins
- 4.3.3 Cyber-security & data-privacy breaches
- 4.3.4 Supply crunch in prime urban locations during mega events (under-reported)
- 4.4 Value / Supply-Chain Analysis
- 4.5 Regulatory Landscape
- 4.6 Technological Outlook
- 4.7 Porter's Five Forces
- 4.7.1 Threat of New Entrants
- 4.7.2 Bargaining Power of Suppliers
- 4.7.3 Bargaining Power of Buyers
- 4.7.4 Threat of Substitutes
- 4.7.5 Competitive Rivalry
5 Market Size & Growth Forecasts
- 5.1 By Platform
- 5.1.1 Mobile Application
- 5.1.2 Website
- 5.2 By Mode of Booking
- 5.2.1 Third-party online portals
- 5.2.2 Direct/captive portals
- 5.3 By Property Type
- 5.3.1 Hotels & Resorts
- 5.3.2 Vacation Rentals
- 5.3.3 Hostels & Budget Accommodations
- 5.3.4 Alternate Lodgings (Glamping, Farm-stays)
- 5.4 By Geography
- 5.4.1 North America
- 5.4.1.1 United States
- 5.4.1.2 Canada
- 5.4.1.3 Mexico
- 5.4.2 South America
- 5.4.2.1 Brazil
- 5.4.2.2 Peru
- 5.4.2.3 Chile
- 5.4.2.4 Argentina
- 5.4.2.5 Rest of South America
- 5.4.3 Europe
- 5.4.3.1 United Kingdom
- 5.4.3.2 Germany
- 5.4.3.3 France
- 5.4.3.4 Spain
- 5.4.3.5 Italy
- 5.4.3.6 BENELUX (Belgium, Netherlands, Luxembourg)
- 5.4.3.7 NORDICS (Denmark, Finland, Iceland, Norway, Sweden)
- 5.4.3.8 Rest of Europe
- 5.4.4 Asia-Pacific
- 5.4.4.1 India
- 5.4.4.2 China
- 5.4.4.3 Japan
- 5.4.4.4 Australia
- 5.4.4.5 South Korea
- 5.4.4.6 South-East Asia (Singapore, Malaysia, Thailand, Indonesia, Vietnam, Philippines)
- 5.4.4.7 Rest of Asia-Pacific
- 5.4.5 Middle East and Africa
- 5.4.5.1 United Arab Emirates
- 5.4.5.2 Saudi Arabia
- 5.4.5.3 South Africa
- 5.4.5.4 Nigeria
- 5.4.5.5 Rest of Middle East and Africa
- 5.4.1 North America
6 Competitive Landscape
- 6.1 Market Concentration
- 6.2 Strategic Moves
- 6.3 Market Share Analysis
- 6.4 Company Profiles (includes Global level Overview, Market level overview, Core Segments, Financials as available, Strategic Information, Market Rank/Share for key companies, Products & Services, and Recent Developments)
- 6.4.1 Booking Holdings Inc.
- 6.4.2 Expedia Group Inc.
- 6.4.3 Airbnb Inc.
- 6.4.4 Trip.com Group Ltd.
- 6.4.5 Agoda Company Pte. Ltd.
- 6.4.6 MakeMyTrip Ltd.
- 6.4.7 Trivago N.V.
- 6.4.8 OYO Rooms
- 6.4.9 Hopper Inc.
- 6.4.10 eDreams ODIGEO
- 6.4.11 Despegar.com Corp.
- 6.4.12 Tujia.com
- 6.4.13 Rakuten Travel
- 6.4.14 Hotels.com
- 6.4.15 Marriott International (Direct)
- 6.4.16 Hilton Worldwide Holdings (Direct)
- 6.4.17 Accor S.A.
- 6.4.18 InterContinental Hotels Group PLC
- 6.4.19 Priceline.com
7 Market Opportunities & Future Outlook
- 7.1 Dynamic Packaging & Ancillary Revenue Bundling
- 7.2 Integration of Web3 & Tokenized Loyalty Programs

