
PUBLISHER: Mordor Intelligence | PRODUCT CODE: 1906122

PUBLISHER: Mordor Intelligence | PRODUCT CODE: 1906122
Investment Banking - Market Share Analysis, Industry Trends & Statistics, Growth Forecasts (2026 - 2031)
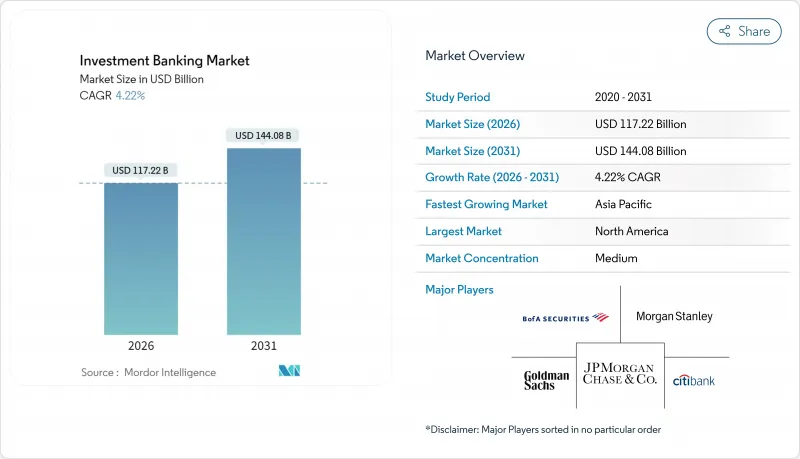
The Investment Banking Market was valued at USD 112.47 billion in 2025 and estimated to grow from USD 117.22 billion in 2026 to reach USD 144.08 billion by 2031, at a CAGR of 4.22% during the forecast period (2026-2031).
Rate-cut cycles in the United States, stabilizing inflation, and healthy corporate balance sheets are creating favorable conditions for mergers, acquisitions, and capital-market issuances. Deal pipelines are replenishing as private-equity sponsors reopen exit routes and corporates prioritize strategic expansion over share buy-backs. At the same time, artificial-intelligence deployments are lowering operating costs, while tokenization pilots are expanding product scope for both public and private-market assets. Regulatory recalibration-especially the gradual roll-out of Basel III revisions-continues to shape capital allocation decisions, pressuring return profiles yet encouraging new fee opportunities in advisory, risk transfer, and capital optimization services.
Global Investment Banking Market Trends and Insights
Sustained acceleration in global M&A volumes
Global deal value is rebounding as financing costs ease and boardroom confidence improves. Major banks forecast 10%-15% growth in aggregate M&A value for 2025, led by cross-border combinations in technology, healthcare, and industrials. Private-equity sponsors are re-entering the market to resolve exit backlogs, altering the competitive bid landscape, and lifting advisory pipelines. Industrial manufacturers illustrate the trend, pursuing scale to digitize production, replace aging assets, and meet sustainability targets. Healthcare activity mirrors this momentum, with large pharmaceutical companies tackling looming patent cliffs through bolt-on acquisitions and licensing transactions.
Robust expansion of debt-capital markets
Lower real yields and upcoming refinancing walls are driving record bond issuance windows. Corporates plan to float more than USD 1.5 trillion of U.S. paper in 2025, switching from short-dated to longer-tenor structures as the Federal Reserve eases policy. In Europe, declining policy rates underpin an 8% increase in investment-grade supply expectations for 2025. Investor appetite for high-yield remains solid, helped by coupons above 7.5% in the U.S. and 5.7% in Europe. Sustainable bonds are adding further volume, with projections that green, social, and sustainability-linked formats will approach EUR 900 billion in 2025.
Heightened post-crisis regulatory capital, liquidity, and resolution requirements
Basel III end-game rules ratified in the United States lift minimum capital 9%-16% for large banks, while Europe's CRR III imposes output floors that raise Tier 1 requirements 8.6%-12.2%. Divergent timelines across the U.K., EU, and U.S. complicate group-wide capital planning and can skew product profitability. Banks are increasingly issuing capital-relief transactions and synthetic risk-transfer structures to navigate higher risk-weighted asset charges. The resulting balance-sheet constraints may curtail risk-warehousing capacity in trading and underwriting desks.
Other drivers and restraints analyzed in the detailed report include:
- Resurgence of IPO and SPAC activity
- Rapid increase in ESG-linked underwriting and advisory mandates
- Intensifying fee compression and price competition
For complete list of drivers and restraints, kindly check the Table Of Contents.
Segment Analysis
Mergers and acquisitions generated the largest 38.35% slice of the investment banking market in 2025, reflecting corporates' preference for inorganic growth in a low-rate setting. Pent-up sponsor exits, cross-border consolidation, and strategic repositioning needs continue to populate pipelines, lifting fee pools for legal, valuation, and financing workstreams. On the debt side, historically attractive coupons support a steady issuance calendar, but regulatory capital charges on underwriting inventories remain a profitability drag.
Equity capital markets constitute the fastest-expanding segment, advancing at a 5.54% CAGR through 2031 on the back of revived IPO and follow-on activity. The investment banking market size for equity offerings is set to widen as AI, biotech, and clean-energy issuers tap public funds to accelerate innovation cycles. Recent easing of SPAC headwinds further diversifies listing routes, enabling issuers to pair capital raising with acquisition currency flexibility.
Transactions valued at USD 1-5 billion accounted for 33.78% of the investment banking market size in 2025, underscoring the appeal of strategically significant yet financially digestible deals that deliver scale efficiencies. Mega-deals above USD 5 billion remain episodic but draw marquee advisory fees when sector consolidation imperatives align with accommodating credit conditions.
Activity below USD 250 million is forecasted to register a brisk 6.66% CAGR as digital platforms simplify documentation and due diligence processes. Lower entry thresholds attract entrepreneurial founders and mid-cap corporates seeking bolt-on capabilities, particularly in advanced manufacturing and data-infrastructure niches. Automation in pitch generation and document management shortens execution timelines, making smaller tickets more economical for banking teams.
The Global Investment Banking Market is Segmented by Product Type (Mergers and Acquisitions, Debt Capital Markets, and More), by Deal Size (Mega-Cap, Large-Cap, Mid-Market, Small-Cap), by Client Type (Large Enterprises, Small and Medium-Sized Enterprises), and by Industrial Vertical (BFSI, IT and Telecommunication, and More) and by Region (North America, Europe, and More). The Market Forecasts are Provided in Terms of Value (USD).
Geography Analysis
North America held a commanding 52.10% share of the investment banking market in 2025 as the region benefited from deep capital-market liquidity, accommodative monetary policy shifts, and anticipated regulatory easing. U.S. corporations intend to refinance more than USD 1 trillion of debt in 2025 and exploit a resurgent IPO window that already hosted 163 offerings in 2024. Canadian and Mexican issuers add complementary deal flow in mining, energy transition, and cross-border supply-chain reconfiguration.
Asia-Pacific is the fastest-growing region in the investment banking market, slated for a 6.37% CAGR through 2031. Structural reforms in China, India, and Southeast Asia are deepening local capital markets and encouraging outbound M&A. As transaction banking represents nearly half of regional CIB income, banks are scaling digital trade-finance platforms to win wallet share with SMEs and mid-caps. Japan and South Korea contribute through technology joint ventures and shareholder-return enhancements, while Australia's infrastructure privatization pipeline supplies sizeable underwriting mandates.
Europe maintains relevance in the investment banking market despite macro uncertainty. Energy transition programs and sovereign-wealth-fund inflows from the Middle East are supporting infrastructure and renewables financing, while regulatory fragmentation complicates cross-border banking operations. In the Middle East, GCC banks are leveraging non-oil diversification projects and sovereign-wealth-fund deal-making, with regional investment-banking revenue expected to grow significantly in the coming years. Africa and South America provide niche opportunities in commodities, infrastructure, and fintech, attracting specialized advisory boutiques alongside global universal banks.
List of Companies Covered in this Report:
- J.P. Morgan Chase & Co.
- Goldman Sachs Group Inc.
- Morgan Stanley
- BofA Securities Inc.
- Citi Group Inc.
- Barclays Investment Bank
- Daiwa Securities Group
- Deutsche Bank AG
- Wells Fargo & Company
- RBC Capital Markets
- Jefferies Financial Group
- Societe Generale Corporate and Investment Banking
- Mizuho Financial Group
- UBS Investment Bank
- HSBC Global Banking & Markets
- Lazard Ltd.
- Nomura Holdings Inc.
- Macquarie Group Ltd.
- BNP Paribas CIB
- Banco Santander CIB
Additional Benefits:
- The market estimate (ME) sheet in Excel format
- 3 months of analyst support
TABLE OF CONTENTS
1 Introduction
- 1.1 Study Assumptions & Market Definition
- 1.2 Scope of the Study
2 Research Methodology
3 Executive Summary
4 Market Landscape
- 4.1 Market Overview
- 4.2 Market Drivers
- 4.2.1 Sustained acceleration in global mergers and acquisitions (M&A) volumes
- 4.2.2 Robust expansion of debt-capital markets as low real interest rates and yield
- 4.2.3 Resurgence of initial public offerings (IPOs) and special-purpose acquisition company (SPAC) activity
- 4.2.4 Rapid increase in ESG-linked underwriting and advisory mandates
- 4.2.5 Emergence of tokenised securities and other blockchain-enabled capital-market instruments
- 4.2.6 Growing direct-investment appetite of sovereign wealth funds (SWFs) and public pension plans
- 4.3 Market Restraints
- 4.3.1 Heightened post-crisis regulatory capital, liquidity and resolution requirements
- 4.3.2 Intensifying fee compression and price competition
- 4.3.3 Accelerated talent migration toward fintech start-ups, private-equity sponsors and corporate development roles
- 4.3.4 Escalating cyber-security and operational-resilience risks
- 4.4 Value / Supply-Chain Analysis
- 4.5 Regulatory Landscape
- 4.6 Technological Outlook
- 4.7 Porter's Five Forces
- 4.7.1 Bargaining Power of Buyers
- 4.7.2 Bargaining Power of Suppliers
- 4.7.3 Threat of New Entrants
- 4.7.4 Threat of Substitutes
- 4.7.5 Intensity of Competitive Rivalry
5 Market Size & Growth Forecasts (Value)
- 5.1 By Product Type
- 5.1.1 Mergers & Acquisitions
- 5.1.2 Debt Capital Markets
- 5.1.3 Equity Capital Markets
- 5.1.4 Syndicated Loans & Others
- 5.2 By Deal Size
- 5.2.1 Mega-cap ( More than USD 5 billion)
- 5.2.2 Large-cap (USD 1-5 billion)
- 5.2.3 Mid-market (USD 250 million -1 billion)
- 5.2.4 Small-cap (Less than USD 250 million)
- 5.3 By Client Type
- 5.3.1 Large Enterprises
- 5.3.2 Small and Medium-sized Enterprises (SMEs)
- 5.4 By Industry Vertical
- 5.4.1 Banking, Financial Services, Insurance (BFSI)
- 5.4.2 IT & Telecommunication
- 5.4.3 Manufacturing
- 5.4.4 Retail And E-Commerce
- 5.4.5 Public Sector
- 5.4.6 Healthcare And Pharmaceuticals
- 5.4.7 Other Industry Verticals
- 5.5 By Region
- 5.5.1 North America
- 5.5.1.1 United States
- 5.5.1.2 Canada
- 5.5.1.3 Mexico
- 5.5.2 South America
- 5.5.2.1 Brazil
- 5.5.2.2 Argentina
- 5.5.2.3 Chile
- 5.5.2.4 Peru
- 5.5.2.5 Rest of South America
- 5.5.3 Europe
- 5.5.3.1 United Kingdom
- 5.5.3.2 Germany
- 5.5.3.3 France
- 5.5.3.4 Spain
- 5.5.3.5 Italy
- 5.5.3.6 Benelux (Belgium, Netherlands, and Luxembourg)
- 5.5.3.7 Nordics (Sweden, Norway, Denmark, Finland, and Iceland)
- 5.5.3.8 Rest of Europe
- 5.5.4 Asia-Pacific
- 5.5.4.1 China
- 5.5.4.2 India
- 5.5.4.3 Japan
- 5.5.4.4 South Korea
- 5.5.4.5 Australia
- 5.5.4.6 South-East Asia (Singapore, Indonesia, Malaysia, Thailand, Vietnam, and Philippines)
- 5.5.4.7 Rest of Asia-Pacific
- 5.5.5 Middle East and Africa
- 5.5.5.1 United Arab Emirates
- 5.5.5.2 Saudi Arabia
- 5.5.5.3 South Africa
- 5.5.5.4 Nigeria
- 5.5.5.5 Rest of Middle East and Africa
- 5.5.1 North America
6 Competitive Landscape
- 6.1 Market Concentration
- 6.2 Strategic Moves
- 6.3 Market Share Analysis
- 6.4 Company Profiles (includes Global Level Overview, Market Level Overview, Core Segments, Financials as available, Strategic Information, Market Rank/Share for Key Companies, Products & Services, and Recent Developments)
- 6.4.1 J.P. Morgan Chase & Co.
- 6.4.2 Goldman Sachs Group Inc.
- 6.4.3 Morgan Stanley
- 6.4.4 BofA Securities Inc.
- 6.4.5 Citi Group Inc.
- 6.4.6 Barclays Investment Bank
- 6.4.7 Daiwa Securities Group
- 6.4.8 Deutsche Bank AG
- 6.4.9 Wells Fargo & Company
- 6.4.10 RBC Capital Markets
- 6.4.11 Jefferies Financial Group
- 6.4.12 Societe Generale Corporate and Investment Banking
- 6.4.13 Mizuho Financial Group
- 6.4.14 UBS Investment Bank
- 6.4.15 HSBC Global Banking & Markets
- 6.4.16 Lazard Ltd.
- 6.4.17 Nomura Holdings Inc.
- 6.4.18 Macquarie Group Ltd.
- 6.4.19 BNP Paribas CIB
- 6.4.20 Banco Santander CIB
7 Market Opportunities & Future Outlook
- 7.1 White-Space & Unmet-Need Assessment

