
PUBLISHER: Mordor Intelligence | PRODUCT CODE: 1906173

PUBLISHER: Mordor Intelligence | PRODUCT CODE: 1906173
Express Delivery - Market Share Analysis, Industry Trends & Statistics, Growth Forecasts (2026 - 2031)
The Express Delivery Market was valued at USD 255.35 billion in 2025 and estimated to grow from USD 270.47 billion in 2026 to reach USD 361.26 billion by 2031, at a CAGR of 5.92% during the forecast period (2026-2031).
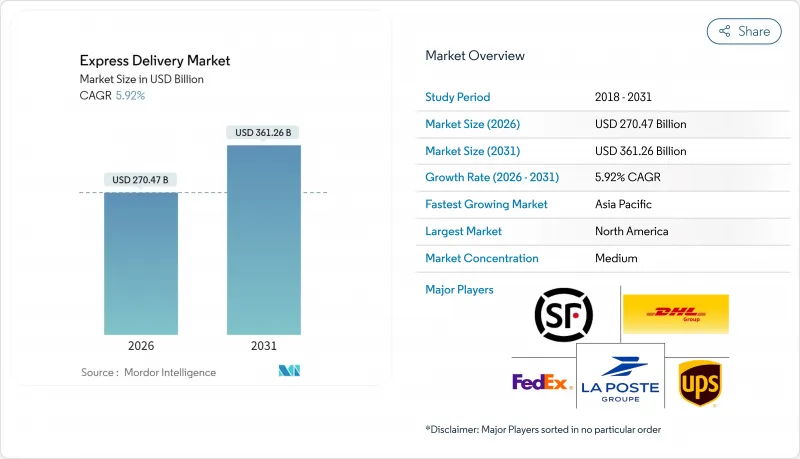
Intensifying cross-border e-commerce activity, rising adoption of digital trade corridors, and accelerating demand for healthcare cold chains are strengthening fundamentals, even as volatile energy prices and labor costs test operator profitability. Network scale remains the primary competitive moat, yet technology investments in automation, data analytics, and alternative last-mile modes are allowing agile entrants to challenge incumbents in niche pockets. Regional dynamics continue to evolve: North America commands the largest share due to mature infrastructure and consumer premium-service appetite, while Asia-Pacific registers the fastest growth on the back of mobile-first commerce and digital payment penetration.
Global Express Delivery Market Trends and Insights
Surging Demand From Cross-Border E-Commerce
Cross-border parcel volumes are climbing at a 7.44% CAGR (2025-2030), comfortably outpacing overall market growth and signaling a structural pivot toward international sourcing. Trade agreements such as USMCA and RCEP are streamlining customs data exchange and trimming paperwork, reducing average clearance times by almost one-third. Dedicated cross-border hubs established by major express carriers now anchor multi-country distribution and allow shipment consolidation that preserves margins despite higher service expectations. International parcels typically command prices three to five times domestic equivalents, providing operators with critical earnings diversity. Investment in bonded warehouses, digital customs platforms, and localized last-mile collaborations further widens the moat for networks able to synchronize global inventory flows.
Growing Consumer Expectation for Same-Day and On-Demand Delivery
Same-day fulfillment has shifted from novelty to a hygiene factor, especially in metropolitan catchments where population density supports route density economics. Amazon's 2024 roll-out to more than 90 U.S. cities accelerated competitive responses, forcing rivals to compress order-to-delivery cycles through micro-fulfillment build-outs and real-time inventory visibility. Urban route-optimization algorithms are trimming per-package costs 15-20%, but only when shipment density crosses critical thresholds. The bifurcation of premium time-sensitive demand and value-focused slower tiers enables carriers to sharpen their segmentation strategy, charging differentiated tariffs while rationalizing fleet utilization. Continuous demand peaks around seasonal promotions are pressuring operators to adopt dynamic pricing and predictive staffing models that align capacity with hourly volume swings.
Volatile Energy Prices and Rising Workforce Costs
Fuel typically constitutes 15-20% of an express carrier's operating cost base; hence, a sudden spike reverberates immediately through earnings. In 2024, FedEx lifted its fuel surcharge by 12.5% after geopolitical tensions tightened crude supply. Concurrent talent scarcity pushed driver wages up 8-12% across North America and Western Europe. Electrification and route-planning software mitigate exposure yet require multi-year payback. Smaller regional players lacking balance-sheet depth resort to aggressive pricing to retain volume, eroding margins further. Persistent cost volatility compels network redesign toward consolidation of linehaul legs and greater use of alternative fuels where grid infrastructure permits.
Other drivers and restraints analyzed in the detailed report include:
- Expanding Healthcare Shipments and Growing Cold-Chain Logistics
- SME Digitization Unlocking New B2C Parcel Flows in Emerging Markets
- Complex and Inconsistent International Shipping Rules
For complete list of drivers and restraints, kindly check the Table Of Contents.
Segment Analysis
E-commerce shipments remain the bedrock of the express delivery market with a revenue share of 32.55% in 2025, supplying predictable volume surges tied to promotional calendars and facilitating data-driven route optimization. Even mature geographies continue to register double-digit parcel growth as same-day propositions unlock incremental frequency.
Healthcare's 6.30% CAGR between 2026-2031 showcases mounting reliance on temperature-controlled, track-and-trace chains of custody. Express carriers are integrating validated packaging, redundant cooling systems, and in-flight monitoring to uphold regulatory obligations. Manufacturers value door-to-door visibility that minimizes spoilage risk and speeds product recalls when necessary. This synergy elevates the express delivery industry's role from mere carrier to strategic supply-chain partner within life-sciences ecosystems.
International shipments are expected to grow faster at a 7.31% CAGR (2026-2031), compared to domestic traffic, fueled by premium cross-border demand and reduced customs friction. Express carriers with bonded hubs and brokerage expertise command pricing power, even as geopolitical risks remain a watch point. Domestic parcels with a revenue share of 65.72% in 2025, while delivering scale economies, face margin compression from intense competition and rising last-mile labor costs.
International revenue benefits from trade corridor digitization initiatives that cut clearance times and enable real-time tracking. The express delivery market size tied to cross-border flows is on track to widen its contribution over the forecast horizon, reinforcing the need for agile capacity management and bilateral air-freight agreements.
The Express Delivery Market Report is Segmented by Destination (Domestic and International), Shipment Weight (Heavy Weight Shipments and More), Model (Business-To-Business (B2B) and More), End User Industry (E-Commerce, Healthcare, and Others), Mode of Transport (Road, Air, and Others), and Geography (Asia-Pacific, Europe, Middle East and Africa, and More). The Market Forecasts are Provided in Terms of Value (USD).
Geography Analysis
North America's 35.12% revenue share in 2025 underscores the region's advanced e-commerce penetration, expansive highway infrastructure, and high discretionary income. Dense urban agglomerations such as New York, Los Angeles, and Toronto sustain same-day networks that command premium tariffs. The United States anchors cross-border flows under the USMCA, ensuring tariff stability and simplified customs interfaces, while Canada's bilingual market and Mexico's maquiladora corridors contribute diversified volume mixes. Labor cost inflation and stricter greenhouse-gas reporting pose immediate profitability challenges.
Asia-Pacific is expected to lead global growth at a 7.45% CAGR between 2026-2031 as mobile wallets and social-commerce platforms unlock incremental shopper cohorts. China's parcel density dwarfs all peers, yet India, Indonesia, and Vietnam are scaling rapidly through merchant onboarding incentives. Regional governments promote integrated digital-trade frameworks, exemplified by ASEAN's single-window customs blueprint that trims clearance to under six hours on compliant shipments. Infrastructure bottlenecks persist, but aggressive investment in smart logistics parks and secondary-city airports is bridging capacity gaps.
Europe maintains steady expansion supported by harmonized customs codes and short-haul cross-border commerce facilitated by open internal borders. Fleet electrification mandates and escalating congestion charges elevate operating costs but also reward early adopters via preferred delivery slots and corporate customer preference for sustainable options. Eastern European markets offer under-penetrated growth avenues where rising incomes and EU funding accelerate parcel adoption. Middle East & Africa and South America collectively represent a smaller share yet deliver high-single-digit growth as infrastructure and fintech advances broaden serviceable addressable markets. Long-run prospects hinge on political stability, customs modernization, and expanded air-cargo corridors connecting secondary cities to global trade lanes.
- Aramex PJSC
- Australian Postal Corporation
- Canada Post Corporation (Including Purolator, Inc.)
- China Post
- CJ Logistics
- Delhivery, Ltd.
- DHL Group
- Emirates Post Group
- FedEx
- InPost Sp. z o.o.
- International Distribution Services PLC
- Japan Post Holdings Co., Ltd.
- JD.com, Inc. (Including JD Logistics, Inc.)
- Korea Post
- La Poste Group (Including DPD Group)
- Nippon Express Holdings
- Osterreichische Post AG (Austrian Post)
- Poste Italiane
- PostNL N.V.
- SF Holding Co., Ltd. (Including KEX-SF)
- SG Holdings Co., Ltd.
- STO Express Co., Ltd.
- United Parcel Service of America, Inc. (UPS)
- Yamato Holdings Co., Ltd.
Additional Benefits:
- The market estimate (ME) sheet in Excel format
- 3 months of analyst support
TABLE OF CONTENTS
1 Introduction
- 1.1 Study Assumptions and Market Definition
- 1.2 Scope of the Study
2 Research Methodology
3 Executive Summary
4 Market Landscape
- 4.1 Market Overview
- 4.2 Demographics
- 4.3 GDP Distribution by Economic Activity
- 4.4 GDP Growth by Economic Activity
- 4.5 Inflation
- 4.6 Economic Performance and Profile
- 4.6.1 Trends in E-Commerce Industry
- 4.6.2 Trends in Manufacturing Industry
- 4.7 Transport and Storage Sector GDP
- 4.8 Export Trends
- 4.9 Import Trends
- 4.10 Fuel Price
- 4.11 Logistics Performance
- 4.12 Infrastructure
- 4.13 Regulatory Framework
- 4.14 Value Chain and Distribution Channel Analysis
- 4.15 Market Drivers
- 4.15.1 Surging Demand Driven by Cross-Border E-Commerce Growth
- 4.15.2 Growing Consumer Expectation for Same-Day and On-Demand Delivery
- 4.15.3 Expanding Healthcare Shipments and Growing Cold-Chain Logistics
- 4.15.4 SME Digitization Unlocking New B2C Parcel Flows in Emerging Markets
- 4.15.5 Faster Border Clearance Enabled by Digital Trade Corridors
- 4.15.6 Automation, Drones, and Ground Robots Revolutionizing Last-Mile Delivery
- 4.16 Market Restraints
- 4.16.1 Volatile Energy Prices and Rising Workforce Costs Challenge Profitability
- 4.16.2 Complex and Inconsistent International Shipping Rules Create Uncertainty
- 4.16.3 Urban Zero-Emission Zones and Congestion Charges Impact Delivery Operations
- 4.16.4 Capacity Bottlenecks at Secondary Airports and Sort Centers Restrict Growth
- 4.17 Technology Innovations in the Market
- 4.18 Porter's Five Forces Analysis
- 4.18.1 Threat of New Entrants
- 4.18.2 Bargaining Power of Buyers
- 4.18.3 Bargaining Power of Suppliers
- 4.18.4 Threat of Substitutes
- 4.18.5 Competitive Rivalry
5 Market Size and Growth Forecasts (Value, USD)
- 5.1 Destination
- 5.1.1 Domestic
- 5.1.2 International
- 5.2 Shipment Weight
- 5.2.1 Heavy Weight Shipments
- 5.2.2 Light Weight Shipments
- 5.2.3 Medium Weight Shipments
- 5.3 Model
- 5.3.1 Business-to-Business (B2B)
- 5.3.2 Business-to-Consumer (B2C)
- 5.3.3 Consumer-to-Consumer (C2C)
- 5.4 End User Industry
- 5.4.1 E-Commerce
- 5.4.2 Financial Services (BFSI)
- 5.4.3 Healthcare
- 5.4.4 Manufacturing
- 5.4.5 Primary Industry
- 5.4.6 Wholesale and Retail Trade (Offline)
- 5.4.7 Others
- 5.5 Mode of Transport
- 5.5.1 Road
- 5.5.2 Air
- 5.5.3 Others
- 5.6 Geography
- 5.6.1 Asia-Pacific
- 5.6.1.1 Australia
- 5.6.1.2 China
- 5.6.1.3 India
- 5.6.1.4 Indonesia
- 5.6.1.5 Japan
- 5.6.1.6 Malaysia
- 5.6.1.7 Philippines
- 5.6.1.8 Thailand
- 5.6.1.9 Vietnam
- 5.6.1.10 Rest of Asia-Pacific
- 5.6.2 Europe
- 5.6.2.1 France
- 5.6.2.2 Germany
- 5.6.2.3 Italy
- 5.6.2.4 Netherlands
- 5.6.2.5 Spain
- 5.6.2.6 United Kingdom
- 5.6.2.7 Nordics
- 5.6.2.8 Central and Eastern Europe (CEE)
- 5.6.2.9 Rest of Europe
- 5.6.3 Middle East and Africa
- 5.6.3.1 Qatar
- 5.6.3.2 Saudi Arabia
- 5.6.3.3 United Arab Emirates
- 5.6.3.4 Egypt
- 5.6.3.5 Nigeria
- 5.6.3.6 South Africa
- 5.6.3.7 Rest of Middle East and Africa
- 5.6.4 North America
- 5.6.4.1 Canada
- 5.6.4.2 Mexico
- 5.6.4.3 United States
- 5.6.4.4 Rest of North America
- 5.6.5 South America
- 5.6.5.1 Argentina
- 5.6.5.2 Brazil
- 5.6.5.3 Chile
- 5.6.5.4 Rest of South America
- 5.6.1 Asia-Pacific
6 Competitive Landscape
- 6.1 Market Concentration
- 6.2 Key Strategic Moves
- 6.3 Market Share Analysis
- 6.4 Company Profiles (Includes Global Level Overview, Market Level Overview, Core Segments, Financials as Available, Strategic Information, Market Rank/Share for Key Companies, Products and Services, and Recent Developments)
- 6.4.1 Aramex PJSC
- 6.4.2 Australian Postal Corporation
- 6.4.3 Canada Post Corporation (Including Purolator, Inc.)
- 6.4.4 China Post
- 6.4.5 CJ Logistics
- 6.4.6 Delhivery, Ltd.
- 6.4.7 DHL Group
- 6.4.8 Emirates Post Group
- 6.4.9 FedEx
- 6.4.10 InPost Sp. z o.o.
- 6.4.11 International Distribution Services PLC
- 6.4.12 Japan Post Holdings Co., Ltd.
- 6.4.13 JD.com, Inc. (Including JD Logistics, Inc.)
- 6.4.14 Korea Post
- 6.4.15 La Poste Group (Including DPD Group)
- 6.4.16 Nippon Express Holdings
- 6.4.17 Osterreichische Post AG (Austrian Post)
- 6.4.18 Poste Italiane
- 6.4.19 PostNL N.V.
- 6.4.20 SF Holding Co., Ltd. (Including KEX-SF)
- 6.4.21 SG Holdings Co., Ltd.
- 6.4.22 STO Express Co., Ltd.
- 6.4.23 United Parcel Service of America, Inc. (UPS)
- 6.4.24 Yamato Holdings Co., Ltd.
7 Market Opportunities and Future Outlook
- 7.1 White-space and Unmet-need Assessment

