
PUBLISHER: Mordor Intelligence | PRODUCT CODE: 1906186

PUBLISHER: Mordor Intelligence | PRODUCT CODE: 1906186
Electric Vehicle Parts And Components - Market Share Analysis, Industry Trends & Statistics, Growth Forecasts (2026 - 2031)
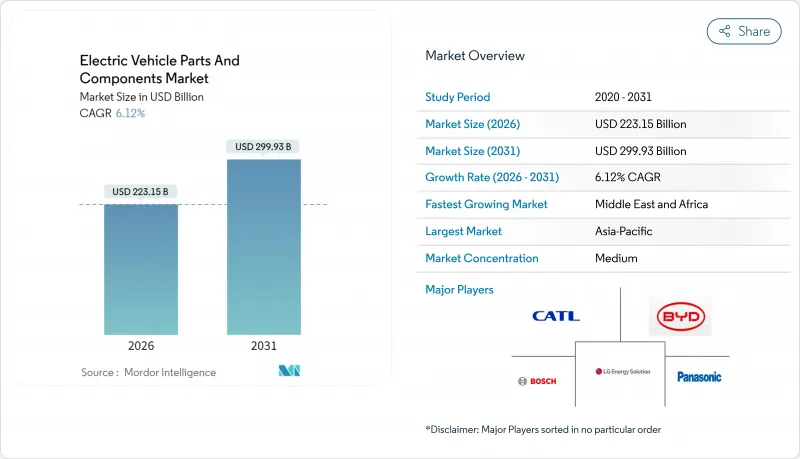
The electric vehicle parts and components market was valued at USD 210.28 billion in 2025 and estimated to grow from USD 223.15 billion in 2026 to reach USD 299.93 billion by 2031, at a CAGR of 6.12% during the forecast period (2026-2031).
Slower expansion versus the earlier double-digit phase signals a shift toward supply-demand balance as scale manufacturing, component standardization, and predictable policy frameworks replace the momentum of early adoption. Declining lithium-ion battery costs, synchronized zero-emission mandates, and rapid public fast-charging roll-outs sustain demand, while OEM migration to 800 V platforms lifts semiconductor content per vehicle. Moderate fragmentation persists because traditional Tier-1 suppliers, battery specialists, and fab-driven semiconductor firms compete across different component layers. Regional supply-chain localization strategies and critical-mineral sourcing challenges continue to shape pricing power and capital-spending priorities across the value chain.
Global Electric Vehicle Parts And Components Market Trends and Insights
Declining Li-ion Battery Costs and Gigafactory Output
Worldwide battery pack prices fell to USD 139 per kWh in 2023 as global cell manufacturing capacity surpassed 1,200 GWh. Falling costs improve electric vehicle affordability, shorten payback periods for fleet operators, and encourage automakers to commit capital to in-house pack assembly lines. Regional gigafactory build-outs in Europe and North America mitigate currency and logistics risks while helping vehicles qualify for domestic-content incentives. Supply security remains vulnerable to lithium hydroxide and high-nickel cathode processing bottlenecks, pressuring mining companies and chemical refiners to accelerate capacity additions. Overall, cheaper packs support higher battery energy density options that keep range anxiety in check and cement the technology roadmap toward solid-state cells.
Government Incentives and ZEV Mandates
The Inflation Reduction Act provides a USD 7,500 tax credit tied to local-content thresholds, pushing suppliers to scale United States production. Europe's Fit for 55 package fixes a 2035 end-date for internal combustion passenger cars, creating long-run visibility for component investments. China's dual-credit mechanism continues stimulating demand after generating 11.3 million EV sales in 2024. Subsidy design now emphasizes domestic manufacturing, R&D grants, and charging-network co-funding, ensuring that policy support transcends retail price cuts. The convergence of regulatory timelines across the three largest auto markets lifts global volumes, allowing suppliers to amortize R&D over broader, more predictable order books.
Critical-Mineral Supply Bottlenecks
In 2024, lithium carbonate prices saw a pronounced early-year surge, only to witness a marked drop as the year drew close. These price swings underscore the evolving global supply-demand landscape, affecting battery production expenses and shaping strategies within the electric vehicle and energy storage sectors. Refining gaps rather than raw-ore shortages became the core constraint, prompting miners and cathode producers to fast-track hydroxide projects with two-year lead times. Cobalt dependence elevates political risk, while nickel sulfate tightness delays high-energy-density designs. Battery makers diversify chemistries toward lithium iron phosphate to ease pressure on constrained materials. Short-term volatility forces OEMs to hedge prices and reevaluate pack design roadmaps.
Other drivers and restraints analyzed in the detailed report include:
- OEM Shift to 800 V Architectures Elevating Power-Electronics Demand
- Rise of Software-Defined E-Powertrain Control Units
- OEM Vertical Integration Squeezing Tier-1 Revenue Pools
For complete list of drivers and restraints, kindly check the Table Of Contents.
Segment Analysis
The passenger car slice of the electric vehicle parts and components market generated 72.65% of 2025 revenue, and commercial vehicles are rising at an 8.46% CAGR, outpacing passenger-car growth. Light commercial vans for last-mile delivery favor right-sized battery packs and cost-optimized thermal systems that operate efficiently in stop-and-go duty cycles. Buses exploit predictable depots, using high-capacity liquid-cooled chargers to amortize higher upfront component costs through daily utilization. Medium and heavy trucks began adopting 300-mile battery configurations that support regional freight corridors, lifting demand for ruggedized cells, megawatt-class charging couplers, and predictive-maintenance sensors. Passenger-car programs display maturity: compact and midsize models reach cost parity, while luxury crossovers spearhead 800 V adoption and silicon-carbide traction inverters. Across both segments, fleets influence procurement cycles, pushing volumes that allow component suppliers to reach scale faster than retail demand alone.
Overall, commercial electrification reshapes aftermarket requirements. Higher daily mileage intensifies wear on cooling plates, cabling, and contactors, expanding replacement parts revenue. Fleet operators demand telematics-enabled condition monitoring, encouraging suppliers to embed sensors that feed cloud analytics. The interdependency between operations data and hardware reliability drives collaboration among vehicle OEMs, telematics providers, and Tier-1s, reinforcing the market's shift toward service-led business models.
Battery electric programs continued to hold a 61.70% revenue share in 2025, underpinned by pack cost declines and a maturing charging network. Plug-in hybrids serve as transition technologies, but declining battery costs erode their value proposition. Fuel cell electric vehicles, although a minor slice in 2025, lead long-haul and heavy-duty pilots because hydrogen refueling aligns with existing freight stop schedules and payload requirements. Their 8.05% CAGR reflects infrastructure investments in corridor refueling hubs rather than broad passenger adoption.
Component implications differ sharply. BEVs prioritize energy-dense cells, fast-charge-capable connectors, and vehicle-to-grid-compatible power modules. FCEVs rely on carbon-fiber hydrogen tanks, platinum-based stacks, and high-temperature compressors. Suppliers across both chains diversify revenue but must manage separate quality regimes and homologation procedures. Policymakers advancing freight-center hydrogen nodes will determine whether FCEV volumes scale sufficiently to alter the component mix by decade-end.
The Electric Vehicle Parts and Components Market Report is Segmented by Vehicle Type (Passenger Cars and Commercial Vehicles), Propulsion Type (Battery Electric Vehicle and More), Component Type (Battery Packs and More), Voltage Platform (Up To 400V Systems, 800V Systems, and Above 800V Systems), and Geography. The Market Forecasts are Provided in Terms of Value (USD).
Geography Analysis
Asia-Pacific held 58.10% of global revenue in 2025, leveraging China's scale from 11.3 million domestic EV registrations that year. China's complete value chain-from lithium conversion and cathode production to motor assembly-creates cost advantages and shortens development loops. Japan specializes in high-precision motors and power electronics, while South Korea leads in NCM cell formulations and pouch technology. India's production-linked incentives catalyze local module factories and attract foreign cell makers, moving the region from final-assembly to deeper component integration across the decade.
The Middle East and Africa register the fastest 2026-to-2031 CAGR at 7.96%. Sovereign wealth projects in the United Arab Emirates and Saudi Arabia finance greenfield EV plants, battery enclosures, and silicon-carbide wafer fabs, leveraging solar resources to lower energy costs for electrolytic processes. South Africa capitalizes on platinum-group metals for fuel-cell stacks and manganese for LFP cathodes, embedding minerals deeper into domestic value chains. Grid upgrades and renewable expansion will dictate the pace at which component production scales regionally.
North America benefits from the Inflation Reduction Act, which ties tax credits to domestic content, GM channeling USD 35 billion into battery-cell and material plants. Localization reduces foreign-exchange risk and freight costs, but also demands new supplier bases for separators, current collectors, and cathode binders. Europe emphasizes recycling quotas and circular-economy directives; new gigafactory projects incorporate black-mass processing lines to capture cobalt and nickel for closed-loop cathodes. Environmental regulations elevate the role of life-cycle-analysis software and traceability modules within each component bill-of-materials.
- Contemporary Amperex Technology Co. Ltd (CATL)
- LG Energy Solution Ltd
- Panasonic Holdings Corp.
- BYD Co. Ltd
- Samsung SDI Co. Ltd
- Robert Bosch GmbH
- Denso Corporation
- Continental AG
- Hyundai Mobis Co. Ltd
- Toyota Industries Corporation
- BorgWarner Inc.
- Hitachi Astemo Ltd
- Nidec Corporation
- Magna International Inc.
- ZF Friedrichshafen AG
- Vitesco Technologies Group AG
- Aisin Corp.
- Valeo SA
- Infineon Technologies AG
- Aptiv PLC
Additional Benefits:
- The market estimate (ME) sheet in Excel format
- 3 months of analyst support
TABLE OF CONTENTS
1 Introduction
- 1.1 Study Assumptions and Market Definition
- 1.2 Scope of the Study
2 Research Methodology
3 Executive Summary
4 Market Landscape
- 4.1 Market Overview
- 4.2 Market Drivers
- 4.2.1 Declining Li-Ion Battery Costs and Gigafactory Output
- 4.2.2 Government Incentives and ZEV Mandates
- 4.2.3 OEM Shift to 800-V Architectures Elevating Power-Electronics Demand
- 4.2.4 Expansion of Public Fast-Charging Infrastructure
- 4.2.5 Silicon-Carbide Device Adoption Lifting Component ASPs
- 4.2.6 Rise of Software-Defined E-Powertrain Control Units
- 4.3 Market Restraints
- 4.3.1 Critical-Mineral Supply Bottlenecks
- 4.3.2 Inadequate Grid Capacity in Emerging Markets
- 4.3.3 Rare-Earth Magnet Price Volatility
- 4.3.4 OEM Vertical Integration Squeezing Tier-1 Revenue Pools
- 4.4 Value / Supply-Chain Analysis
- 4.5 Regulatory Landscape
- 4.6 Technological Outlook
- 4.7 Porter's Five Forces
- 4.7.1 Threat of New Entrants
- 4.7.2 Bargaining Power of Buyers/Consumers
- 4.7.3 Bargaining Power of Suppliers
- 4.7.4 Threat of Substitute Products
- 4.7.5 Intensity of Competitive Rivalry
5 Market Size and Growth Forecasts (Value, USD)
- 5.1 By Vehicle Type
- 5.1.1 Passenger Cars
- 5.1.1.1 Compact
- 5.1.1.2 SUV / Crossover
- 5.1.1.3 Luxury
- 5.1.2 Commercial Vehicles
- 5.1.2.1 Light Commercial Vehicles
- 5.1.2.2 Buses and Coaches
- 5.1.2.3 Medium and Heavy Trucks
- 5.1.1 Passenger Cars
- 5.2 By Propulsion Type
- 5.2.1 Battery Electric Vehicle
- 5.2.2 Plug-in Hybrid Electric Vehicle
- 5.2.3 Hybrid Electric Vehicle
- 5.2.4 Fuel Cell Electric Vehicle
- 5.3 By Component Type
- 5.3.1 Battery Packs
- 5.3.1.1 Battery Cells
- 5.3.1.2 Battery Management Systems
- 5.3.1.3 Battery Thermal Management Systems
- 5.3.2 Electric Motors
- 5.3.2.1 Permanent-Magnet Synchronous
- 5.3.2.2 Induction
- 5.3.2.3 Switched-Reluctance
- 5.3.3 Power Electronics
- 5.3.3.1 Inverters
- 5.3.3.2 DC-DC Converters
- 5.3.3.3 On-board Chargers
- 5.3.4 Thermal-Management Components
- 5.3.4.1 Heat Exchangers
- 5.3.4.2 Cooling Plates
- 5.3.5 Wiring, Harnesses and Connectors
- 5.3.6 Sensors and Control Units
- 5.3.1 Battery Packs
- 5.4 By Voltage Platform
- 5.4.1 Up to 400 V Systems
- 5.4.2 800-V Systems
- 5.4.3 Above 800-V Systems
- 5.5 By Geography
- 5.5.1 North America
- 5.5.1.1 United States
- 5.5.1.2 Canada
- 5.5.1.3 Rest of North America
- 5.5.2 South America
- 5.5.2.1 Brazil
- 5.5.2.2 Argentina
- 5.5.2.3 Rest of South America
- 5.5.3 Europe
- 5.5.3.1 Germany
- 5.5.3.2 United Kingdom
- 5.5.3.3 France
- 5.5.3.4 Italy
- 5.5.3.5 Spain
- 5.5.3.6 Russia
- 5.5.3.7 Rest of Europe
- 5.5.4 Asia-Pacific
- 5.5.4.1 China
- 5.5.4.2 India
- 5.5.4.3 Japan
- 5.5.4.4 South Korea
- 5.5.4.5 Australia
- 5.5.4.6 Rest of Asia-Pacific
- 5.5.5 Middle-East and Africa
- 5.5.5.1 United Arab Emirates
- 5.5.5.2 Saudi Arabia
- 5.5.5.3 Turkey
- 5.5.5.4 Egypt
- 5.5.5.5 South Africa
- 5.5.5.6 Rest of Middle-East and Africa
- 5.5.1 North America
6 Competitive Landscape
- 6.1 Market Concentration
- 6.2 Strategic Moves
- 6.3 Market Share Analysis
- 6.4 Company Profiles (Includes Global Level Overview, Market Level Overview, Core Segments, Financials as Available, Strategic Information, Market Rank/Share for Key Companies, Products & Services, and Recent Developments)
- 6.4.1 Contemporary Amperex Technology Co. Ltd (CATL)
- 6.4.2 LG Energy Solution Ltd
- 6.4.3 Panasonic Holdings Corp.
- 6.4.4 BYD Co. Ltd
- 6.4.5 Samsung SDI Co. Ltd
- 6.4.6 Robert Bosch GmbH
- 6.4.7 Denso Corporation
- 6.4.8 Continental AG
- 6.4.9 Hyundai Mobis Co. Ltd
- 6.4.10 Toyota Industries Corporation
- 6.4.11 BorgWarner Inc.
- 6.4.12 Hitachi Astemo Ltd
- 6.4.13 Nidec Corporation
- 6.4.14 Magna International Inc.
- 6.4.15 ZF Friedrichshafen AG
- 6.4.16 Vitesco Technologies Group AG
- 6.4.17 Aisin Corp.
- 6.4.18 Valeo SA
- 6.4.19 Infineon Technologies AG
- 6.4.20 Aptiv PLC
7 Market Opportunities & Future Outlook

