
PUBLISHER: Mordor Intelligence | PRODUCT CODE: 1906937

PUBLISHER: Mordor Intelligence | PRODUCT CODE: 1906937
Helium - Market Share Analysis, Industry Trends & Statistics, Growth Forecasts (2026 - 2031)
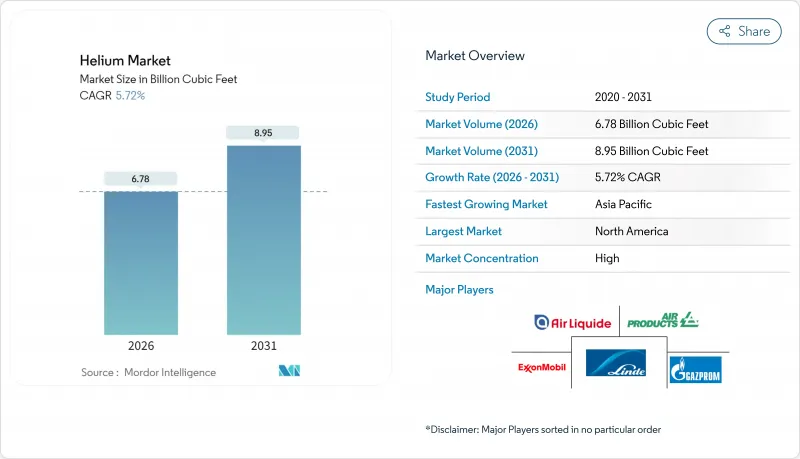
The Helium Market was valued at 6.41 Billion Cubic Feet in 2025 and estimated to grow from 6.78 Billion Cubic Feet in 2026 to reach 8.95 Billion Cubic Feet by 2031, at a CAGR of 5.72% during the forecast period (2026-2031).
Robust demand stems from semiconductor manufacturing, medical imaging, commercial space launch, and quantum computing, each relying on helium's ultra-low boiling point and chemical inertness. The helium market continues to face supply volatility because fewer than 15 producers dominate global output, and the 2024 privatization of the U.S. Federal Helium Reserve removed subsidized stock from the system. New capacity from South Africa, Qatar, and Russia is temporarily easing scarcity, but structural concentration keeps users focused on long-term contracts and recycling investments. Semiconductor capacity additions under the U.S. CHIPS Act, the European Chips Act, and multiple Asian government incentive programs intensify demand, while MRI fleet growth in mid-income nations sustains healthcare's position as the largest end-user.
Global Helium Market Trends and Insights
Explosive Semiconductor Fab Build-Out in East Asia
Foundry expansions in China, Taiwan, Japan, and South Korea are propelling the helium market as chip plants rely on gaseous helium for wafer cleaning, lithography atmosphere control, and plasma etching. Intel, TSMC, and Samsung are building new U.S. and Asian fabs funded by the CHIPS Act and parallel regional programs, each fab requiring hundreds of millions of standard cubic feet of high-purity helium over its lifecycle. Taiwan's clustering effect compounds regional demand, as advanced packaging lines consume helium for die bonding and encapsulation. Overall, semiconductor consumption intensity increases with each node shrink, locking in double-digit demand growth for the helium market through 2030.
MRI Fleet Expansion Across Mid-Income Hospitals
Hospitals in Asia-Pacific, Latin America, and Africa are adding MRI scanners to meet chronic disease diagnostics despite newer helium-light technologies. A conventional 1.5-ton unit needs 1,500-2,000 liters of liquid helium at installation and up to 10,000 liters across its service life. Helium conservation skids that recapture 92% of boil-off gas are spreading to tertiary hospitals, although upfront costs near USD 100,000 restrict adoption mainly to teaching centers. GE HealthCare's Freelium and Siemens Healthineers' DryCool platforms cut helium usage by 99%, yet slow fleet turnover leaves conventional magnets dominant into the next decade.
Finite Reserves and Concentration in a Few Countries
Roughly 70% of known helium reserves sit in the United States, Qatar, Algeria, and Russia, fostering geopolitical leverage and supply manipulation that directly influence the helium market. China imports 95% of its helium needs, underscoring exposure to diplomatic friction and maritime logistics risks. EU sanctions on Russian helium illustrate how quickly policy can reroute trade and spike prices. Co-produced helium may remain trapped underground as natural-gas production tapers under decarbonization agendas. Recycling can cut wastage, but cannot create a new primary supply, reinforcing the imperative for strategic reserves.
Other drivers and restraints analyzed in the detailed report include:
- Commercial Space-Launch Boom Raising Liquid-He Demand
- Quantum-Computing Cryostats Moving from Lab to Pilot Lines
- Tightened Flare-Gas Rules Limiting Co-Produced Helium
For complete list of drivers and restraints, kindly check the Table Of Contents.
Segment Analysis
Gaseous helium held 70.65% of the 2025 volume, reflecting large-scale use in pressurization, purging, and leak-testing, and is growing at a 6.03% CAGR as leading-edge nodes tighten contamination tolerances, sustaining a substantial share of the helium market size for process gases. The gaseous segment also benefits from aerospace welding and additive-manufacturing processes that rely on helium's high thermal conductivity for deep, narrow weld profiles.
Emerging hydrogen-fuel testing and electric-vehicle battery leak detection add incremental volumes, extending gaseous helium's dominance well into the forecast horizon across the helium market. MRI fleet expansion, quantum-system scale-out, and high-energy physics laboratories anchor baseline liquid helium demand. Increasing deployment of on-site liquefiers and 92% efficient recovery skids mitigates boil-off losses, but absolute volumes continue to rise.
The Helium Report is Segmented by Phase (Liquid Helium, and Gaseous Helium), Application (Breathing Mixes, Cryogenics, Leak Detection, Pressurizing and Purging, Welding, and More), End-User Industry (Aerospace and Aircraft, Electronics and Semiconductor, Nuclear Power, Healthcare, Welding and Metal Fabrication, Other End-User Industries), and Geography (Asia-Pacific, North America, Europe, and More).
Geography Analysis
North America commanded 38.55% of 2025 volume, supported by the world's largest proven reserves and mature midstream infrastructure. The Federal Helium Reserve privatization in 2024 shifted the procurement landscape, compelling end-users to negotiate directly with private producers at market rates, but Honeywell's Dry Piney and smaller Rockies projects are filling the gap. Semiconductor fab construction in Arizona, Ohio, and Texas further supports regional consumption growth.
Asia-Pacific is projected to post the highest 7.05% CAGR through 2031 as China, Japan, India, and South Korea ramp up semiconductors, satellite manufacturing, and medical imaging. China's 95% import dependence creates a strategic imperative for contract diversification and micro-liquefier deployment at industrial parks. Japan's incentive packages for next-generation memory plants accelerate helium spending, while India's nascent fab ecosystem and fast-growing healthcare sector widen demand. Regional investment in unconventional helium fields, notably in Australia and Tanzania, aims to hedge supply exposure.
Though smaller in volume, Europe faces structural supply restructuring after sanctions eliminated Russian helium flows. End-users now source from Qatar and the U.S. Gulf Coast, absorbing freight premiums and installation of on-site recovery to cushion volatility.
- Air Liquide
- Air Products and Chemicals, Inc.
- AIR WATER INC
- Buzwair Industrial Gases Factories
- ExxonMobil Corporation
- Gazprom
- Gulf Cryo
- Iwatani Corporation
- Linde plc
- Matheson Tri-Gas Inc.
- Messer Group
- North American Helium
- PGNiG SA
- QatarEnergy LNG
- Renergen
- Weil Group Resources
Additional Benefits:
- The market estimate (ME) sheet in Excel format
- 3 months of analyst support
TABLE OF CONTENTS
1 Introduction
- 1.1 Study Assumptions and Market Definition
- 1.2 Scope of the Study
2 Research Methodology
3 Executive Summary
4 Market Landscape
- 4.1 Market Overview
- 4.2 Market Drivers
- 4.2.1 Explosive Semiconductor Fab Build-Out in East Asia
- 4.2.2 MRI Fleet Expansion across Mid-Income Hospitals
- 4.2.3 Commercial Space-Launch Boom Raising Liquid-He Demand
- 4.2.4 Quantum-Computing Cryostats Moving from Lab to Pilot Lines
- 4.2.5 Pilot-Scale Helium-3 Extraction for Neutron Detection and Fusion Research and Development
- 4.3 Market Restraints
- 4.3.1 Finite Reserves and Concentration In A Few Countries
- 4.3.2 High Liquefaction and Logistics Costs Vs. Substitutes
- 4.3.3 Tightened Flare-Gas Rules Limiting Co-Produced Helium
- 4.4 Value Chain Analysis
- 4.5 Porter's Five Forces
- 4.5.1 Bargaining Power of Suppliers
- 4.5.2 Bargaining Power of Consumers
- 4.5.3 Threat of New Entrants
- 4.5.4 Threat of Substitutes
- 4.5.5 Degree of Competition
5 Market Size and Growth Forecasts (Volume)
- 5.1 By Phase
- 5.1.1 Liquid Helium
- 5.1.2 Gaseous Helium
- 5.2 By Application
- 5.2.1 Breathing Mixes
- 5.2.2 Cryogenics
- 5.2.3 Leak Detection
- 5.2.4 Pressurizing and Purging
- 5.2.5 Welding
- 5.2.6 Controlled Atmosphere
- 5.2.7 Other Applications
- 5.3 By End-User Industry
- 5.3.1 Aerospace and Aircraft
- 5.3.2 Electronics and Semiconductor
- 5.3.3 Nuclear Power
- 5.3.4 Healthcare
- 5.3.5 Welding and Metal Fabrication
- 5.3.6 Other End-User Industries
- 5.4 By Geography
- 5.4.1 Asia-Pacific
- 5.4.1.1 China
- 5.4.1.2 India
- 5.4.1.3 Japan
- 5.4.1.4 South Korea
- 5.4.1.5 Malaysia
- 5.4.1.6 Taiwan
- 5.4.1.7 Thailand
- 5.4.1.8 Indonesia
- 5.4.1.9 Vietnam
- 5.4.1.10 Australia
- 5.4.1.11 New Zealand
- 5.4.1.12 Rest of Asia-Pacific
- 5.4.2 North America
- 5.4.2.1 United States
- 5.4.2.2 Canada
- 5.4.2.3 Mexico
- 5.4.3 Europe
- 5.4.3.1 Germany
- 5.4.3.2 United Kingdom
- 5.4.3.3 Italy
- 5.4.3.4 France
- 5.4.3.5 Poland
- 5.4.3.6 Spain
- 5.4.3.7 Russia
- 5.4.3.8 Rest of Europe
- 5.4.4 South America
- 5.4.4.1 Brazil
- 5.4.4.2 Argentina
- 5.4.4.3 Rest of South America
- 5.4.5 Middle-East and Africa
- 5.4.5.1 Saudi Arabia
- 5.4.5.2 Egypt
- 5.4.5.3 South Africa
- 5.4.5.4 Rest of Middle-East and Africa
- 5.4.1 Asia-Pacific
6 Competitive Landscape
- 6.1 Market Concentration
- 6.2 Strategic Moves
- 6.3 Market Share (%)/Ranking Analysis
- 6.4 Company Profiles (includes Global level Overview, Market level overview, Core Segments, Financials as available, Strategic Information, Market Rank/Share for key companies, Products and Services, and Recent Developments)
- 6.4.1 Air Liquide
- 6.4.2 Air Products and Chemicals, Inc.
- 6.4.3 AIR WATER INC
- 6.4.4 Buzwair Industrial Gases Factories
- 6.4.5 ExxonMobil Corporation
- 6.4.6 Gazprom
- 6.4.7 Gulf Cryo
- 6.4.8 Iwatani Corporation
- 6.4.9 Linde plc
- 6.4.10 Matheson Tri-Gas Inc.
- 6.4.11 Messer Group
- 6.4.12 North American Helium
- 6.4.13 PGNiG SA
- 6.4.14 QatarEnergy LNG
- 6.4.15 Renergen
- 6.4.16 Weil Group Resources
7 Market Opportunities and Future Outlook
- 7.1 White-space and Unmet-need Assessment

