
PUBLISHER: Mordor Intelligence | PRODUCT CODE: 1907001

PUBLISHER: Mordor Intelligence | PRODUCT CODE: 1907001
Protein Bar - Market Share Analysis, Industry Trends & Statistics, Growth Forecasts (2026 - 2031)
The Protein Bar Market was valued at USD 9.73 billion in 2025 and estimated to grow from USD 10.69 billion in 2026 to reach USD 17.17 billion by 2031, at a CAGR of 9.92% during the forecast period (2026-2031).
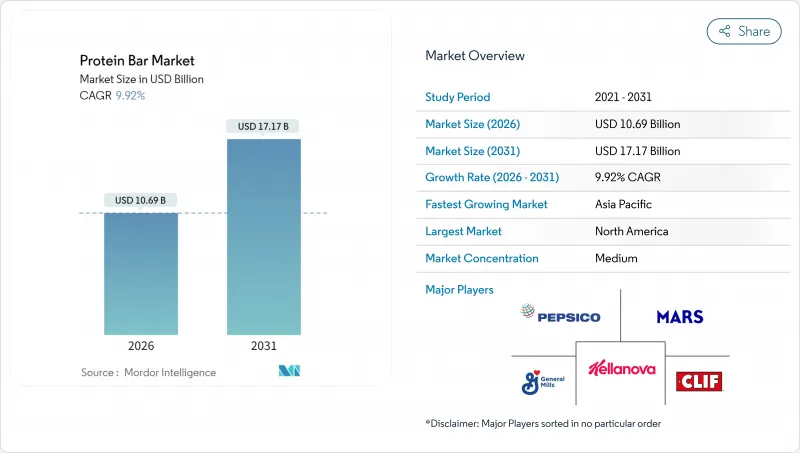
Once limited to bodybuilding circles, protein bars are now widely consumed as pantry staples, workplace snacks, and travel-friendly meal substitutes. This growth is driven by rising demand for clean-label recipes, advancements in plant-based protein technology, and the convenience of digital retail platforms. Established confectionery companies face increasing competition from direct-to-consumer brands focusing on ingredient transparency and indulgent taste profiles. North America leads in market value, while the Asia-Pacific region is growing rapidly due to higher disposable incomes and the global fitness trend. Premium product lines with simplified ingredients and innovative protein sources are gaining traction, supported by subscription models that reduce price comparisons. However, challenges such as regulatory inconsistencies, counterfeit risks in e-commerce, and scrutiny over sugar content could impact growth.
Global Protein Bar Market Trends and Insights
Increased Demand for Antimicrobial and Health-Focused Formulations
In 2024, ProGo launched collagen-infused protein bars designed to enhance skin elasticity and support joint health, catering to the rising consumer demand for functional benefits in everyday products. Similarly, NoFuss introduced bars fortified with vitamins D3, B12, and zinc to address common micronutrient deficiencies in plant-based diets. This shift highlights the growing preference for protein bars that offer multiple health benefits, with consumers increasingly willing to pay a premium for such innovative solutions. The active nutrition sector experienced steady growth in 2024, as these products gained popularity for various daily uses beyond fitness and workouts. To differentiate their offerings, manufacturers are leveraging advanced ingredients like postbiotic strains and prebiotic fibers, which support gut health and overall wellness. However, inconsistent regulatory frameworks for structure-function claims across different markets continue to pose challenges for the industry. By focusing on holistic wellness and functional credibility, brands are successfully capturing market share from traditional meal-replacement bars, which often fail to meet the evolving expectations of health-conscious consumers.
Rise of Plant-Based Protein Systems with Improved Taste/Texture
Recent advancements in plant-based protein technology have significantly improved product quality, achieving sensory parity with whey and addressing a major barrier to plant-based adoption. In 2024, Ingredion introduced Vitessence Pea 100 HD, a pea protein isolate known for its neutral flavor and smooth texture. This innovation allows manufacturers to eliminate the use of masking agents such as cocoa or peanut butter, simplifying formulations. Vivici also launched BLG protein in 2024, developed through precision fermentation. This protein offers a complete amino acid profile while avoiding common legume allergens, making it suitable for a wider range of consumers. Furthermore, CSIRO developed a meat protein powder in 2024 that retains 95% of its original nutritional value, opening new possibilities for hybrid animal-plant protein products, such as protein bars. In April 2025, Barebells introduced vegan Fudge Brownie and Caramel Choco Chip bars, each providing 16 grams of plant protein per serving. This launch demonstrates how European brands are leveraging taste and innovation to compete effectively with established U.S. market leaders.
Regulatory Complexity and Compliance Burden
Multinational brands face challenges due to varying labeling standards enforced by the FDA, EFSA, and FSSAI. These differences require companies to create separate SKUs and production runs, increasing costs by 12-18% compared to brands operating in a single market. In 2024, the FDA will implement updated nutrition facts panel requirements, which include dual-column labeling for bars containing more than 200 calories. This change complicates packaging design and reduces shelf visibility. Similarly, EFSA's approval process for health claims demands clinical trials costing between USD 500,000 and USD 1 million per claim, making it difficult for smaller brands to adopt functional positioning. In India, FSSAI's 2024 front-of-pack labeling regulations introduce a color-coded system, red, amber, or green, to indicate sugar, salt, and fat content. Products with more than 5 grams of sugar per serving may face negative consumer perceptions. These regulatory requirements place a heavier burden on smaller and emerging brands, which often lack dedicated regulatory teams, while established players with strong legal and compliance infrastructures gain a competitive advantage in the market.
Other drivers and restraints analyzed in the detailed report include:
- Growth of Fitness Centers and Gyms
- Retail Modernization and E-Commerce Adoption
- Counterfeit and Low-Quality Products
For complete list of drivers and restraints, kindly check the Table Of Contents.
Segment Analysis
In 2025, nut-based bars accounted for 42.53% of the market, driven by consumers' preference for almonds, cashews, and peanuts. These nuts are popular for their crunchy texture, high protein content, and fats that help keep consumers feeling full for longer. Almonds, for instance, provide 6 grams of protein per ounce and are rich in vitamin E and magnesium, making them a nutrient-dense option that aligns with the growing demand for clean-label products. In the same year, Quaranta launched a nut protein bar combining hazelnuts and almonds with whey isolate, targeting European consumers who favor Mediterranean-inspired ingredients. Similarly, Arla introduced its Essentials Bar in 2024, featuring cashews and peanuts in a simple 10-ingredient recipe free from artificial sweeteners, appealing to health-conscious buyers.
Date-based bars are expected to grow at a CAGR of 7.74% from 2026 to 2031, thanks to their dual role as natural binders and sweeteners. These bars eliminate the need for added sugars or syrups, making them a healthier alternative. Although dates contain 66 grams of sugar per 100 grams, they have a low glycemic index of 42, which helps regulate blood sugar levels better than cane sugar or agave. In 2024, Veganz introduced bars sweetened only with date syrup, offering 12 grams of protein per serving without any added sugars. L-Nutra also launched bars using whole dates, providing fiber and potassium along with protein, catering to consumers looking for functional nutrition beyond basic macronutrients. Additionally, Oobli combined dates with sweet proteins derived from oubli fruit, achieving a 70% reduction in sugar content without the cooling aftertaste associated with erythritol, making it a preferred choice for those seeking reduced-sugar options.
The Protein Bar Market Report is Segmented by Ingredient Base (Nut-Based, Granola/Oat-based, Date-Based, Hybrid Blends, Others), Price Category (Mass, Premium), Distribution Channel (Supermarket/Hypermarket, Online Retail Store, Convenience Store, Other Distribution Channels), and Geography (North America, Europe, Asia-Pacific, South America, Middle East and Africa). The Market Forecasts are Provided in Terms of Value (USD).
Geography Analysis
In 2025, North America accounted for 37.85% of the market share, driven by a strong fitness culture, over 64 million gym memberships, and significant retail shelf space dedicated to protein bars. The U.S. leads this demand, with consumers increasingly using protein bars as meal replacements rather than just sports nutrition products. Approximately 57% of active nutrition users consume these bars for various occasions beyond workouts. Additionally, the use of GLP-1 receptor agonists like semaglutide by 5.6 million Americans in 2024 has indirectly boosted protein intake, as users aim to preserve muscle mass during weight loss. Canada and Mexico also contribute to growth, but regulatory challenges, such as Health Canada's strict health claim standards and Mexico's front-of-pack warning labels, complicate regional product launches. The growing preference among U.S. consumers to reduce sugar intake has led to reformulations using alternatives like erythritol, stevia, and monk fruit.
Asia-Pacific is the fastest-growing region, with a projected CAGR of 9.05% from 2026 to 2031. Rising disposable incomes, urbanization, and increasing fitness center penetration in countries like China, India, Japan, and Australia are driving this growth. According to the National Bureau of Statistics of China, in 2024, the average annual per capita disposable income of households in China amounted to approximately 41,300 CNY, up from 39,218 CNY in 2023. China's middle class, exceeding 400 million people, is adopting fitness habits, with gym memberships steadily increasing and fueling demand for post-workout nutrition. Japan's aging population is creating demand for protein bars fortified with leucine and HMB to prevent muscle loss in individuals over 60. In Australia, protein bars are widely used as convenient energy sources for outdoor activities such as hiking and cycling. The rapid growth of e-commerce across the region is helping brands bypass fragmented retail networks and reach consumers in smaller cities, including tier-2 and tier-3 markets.
Europe and South America are experiencing moderate growth due to economic challenges and consumer preferences for traditional snacks. In Europe, Germany, the U.K., and France lead demand, with consumers prioritizing organic certifications and simple ingredient lists. Brands like Arla and Trek cater to these preferences, while Barebells introduced five new flavors, including vegan options, in 2025 to compete with U.S. brands. In South America, high tariffs and currency fluctuations have raised protein bar prices by 40-60% compared to North America, limiting the market to affluent urban consumers. In the Middle East and Africa, the market is still emerging, with early adoption seen in the UAE and South Africa among expatriates and fitness enthusiasts. Regulatory changes, such as India's FSSAI front-of-pack labeling rules in 2024 and similar initiatives in Saudi Arabia, are influencing how brands position their products regarding sugar content and health claims.
- Associated British Foods PLC
- Barebells Functional Foods AB
- Caveman Foods LLC
- Clif Bar & Company
- Fitshit Health Solutions Pvt. Ltd
- General Mills Inc.
- Glanbia PLC
- GNC Holdings LLC
- The Kellogg Company
- Lotus Bakeries
- Mars Incorporated
- Mondelez International Inc.
- MusclePharm Corporation
- Naturell India Pvt. Ltd
- PepsiCo Inc.
- Premier Nutrition Company LLC
- Quest Nutrition LLC
- RXBAR LLC
- Simply Good Foods Co.
- Stayfit Enterprize Private Limited
- The Hershey Company
Additional Benefits:
- The market estimate (ME) sheet in Excel format
- 3 months of analyst support
TABLE OF CONTENTS
1 INTRODUCTION
- 1.1 Study Assumptions and Market Definition
- 1.2 Scope of the Study
2 RESEARCH METHODOLOGY
3 EXECUTIVE SUMMARY
4 MARKET LANDSCAPE
- 4.1 Market Overview
- 4.2 Market Drivers
- 4.2.1 Increased Demand for Antimicrobial and Health-Focused Formulations
- 4.2.2 Rise of Plant-Based Protein Systems with Improved Taste/Texture
- 4.2.3 Growth of Fitness Centers and Gyms
- 4.2.4 Retail Modernization and E-Commerce Adoption
- 4.2.5 Portion-Controlled, On-the-Go Snacking and Permissible Indulgence
- 4.2.6 Expansion of Clean-Label and Short-Ingredient-List Claims in Bar
- 4.3 Market Restraints
- 4.3.1 Regulatory Complexity and Compliance Burden
- 4.3.2 Counterfeit and Low-Quality Products
- 4.3.3 Negative perception of high sugar bars among health-conscious consumers
- 4.3.4 Allergen Management and Cross-Contamination Risks
- 4.4 Supply Chain Analysis
- 4.5 Regulatory Landscape
- 4.6 Technological Outlook
- 4.7 Porter's Five Forces Analysis
- 4.7.1 Threat of New Entrants
- 4.7.2 Bargaining Power of Buyers
- 4.7.3 Bargaining Power of Suppliers
- 4.7.4 Threat of Substitutes
- 4.7.5 Intensity of Competitive Rivalry
5 MARKET SIZE AND GROWTH FORECASTS (VALUE)
- 5.1 Ingredient Base
- 5.1.1 Nut-based bars
- 5.1.2 Granola/Oat-based
- 5.1.3 Date-based bars
- 5.1.4 Hybrid blends
- 5.1.5 Others
- 5.2 Price Category
- 5.2.1 Mass
- 5.2.2 Premium
- 5.3 Distribution Channel
- 5.3.1 Supermarket/Hypermarket
- 5.3.2 Online Retail Store
- 5.3.3 Convenience Store
- 5.3.4 Other Distribution Channels
- 5.4 Geography
- 5.4.1 North America
- 5.4.1.1 United States
- 5.4.1.2 Canada
- 5.4.1.3 Mexico
- 5.4.1.4 Rest of North America
- 5.4.2 Europe
- 5.4.2.1 Germany
- 5.4.2.2 United Kingdom
- 5.4.2.3 Italy
- 5.4.2.4 France
- 5.4.2.5 Spain
- 5.4.2.6 Netherlands
- 5.4.2.7 Poland
- 5.4.2.8 Belgium
- 5.4.2.9 Sweden
- 5.4.2.10 Rest of Europe
- 5.4.3 Asia-Pacific
- 5.4.3.1 China
- 5.4.3.2 India
- 5.4.3.3 Japan
- 5.4.3.4 Australia
- 5.4.3.5 Indonesia
- 5.4.3.6 South Korea
- 5.4.3.7 Thailand
- 5.4.3.8 Singapore
- 5.4.3.9 Rest of Asia-Pacific
- 5.4.4 South America
- 5.4.4.1 Brazil
- 5.4.4.2 Argentina
- 5.4.4.3 Colombia
- 5.4.4.4 Chile
- 5.4.4.5 Peru
- 5.4.4.6 Rest of South America
- 5.4.5 Middle East and Africa
- 5.4.5.1 South Africa
- 5.4.5.2 Saudi Arabia
- 5.4.5.3 United Arab Emirates
- 5.4.5.4 Nigeria
- 5.4.5.5 Egypt
- 5.4.5.6 Morocco
- 5.4.5.7 Turkey
- 5.4.5.8 Rest of Middle East and Africa
- 5.4.1 North America
6 COMPETITIVE LANDSCAPE
- 6.1 Market Concentration
- 6.2 Strategic Moves
- 6.3 Market Share Analysis
- 6.4 Company Profiles (includes Global level Overview, Market level overview, Core Segments, Financials as available, Strategic Information, Market Rank/Share for key companies, Products and Services, and Recent Developments)
- 6.4.1 Associated British Foods PLC
- 6.4.2 Barebells Functional Foods AB
- 6.4.3 Caveman Foods LLC
- 6.4.4 Clif Bar & Company
- 6.4.5 Fitshit Health Solutions Pvt. Ltd
- 6.4.6 General Mills Inc.
- 6.4.7 Glanbia PLC
- 6.4.8 GNC Holdings LLC
- 6.4.9 The Kellogg Company
- 6.4.10 Lotus Bakeries
- 6.4.11 Mars Incorporated
- 6.4.12 Mondelez International Inc.
- 6.4.13 MusclePharm Corporation
- 6.4.14 Naturell India Pvt. Ltd
- 6.4.15 PepsiCo Inc.
- 6.4.16 Premier Nutrition Company LLC
- 6.4.17 Quest Nutrition LLC
- 6.4.18 RXBAR LLC
- 6.4.19 Simply Good Foods Co.
- 6.4.20 Stayfit Enterprize Private Limited
- 6.4.21 The Hershey Company
7 MARKET OPPORTUNITIES AND FUTURE OUTLOOK

