
PUBLISHER: Mordor Intelligence | PRODUCT CODE: 1907221

PUBLISHER: Mordor Intelligence | PRODUCT CODE: 1907221
Non-Destructive Testing (NDT) - Market Share Analysis, Industry Trends & Statistics, Growth Forecasts (2026 - 2031)
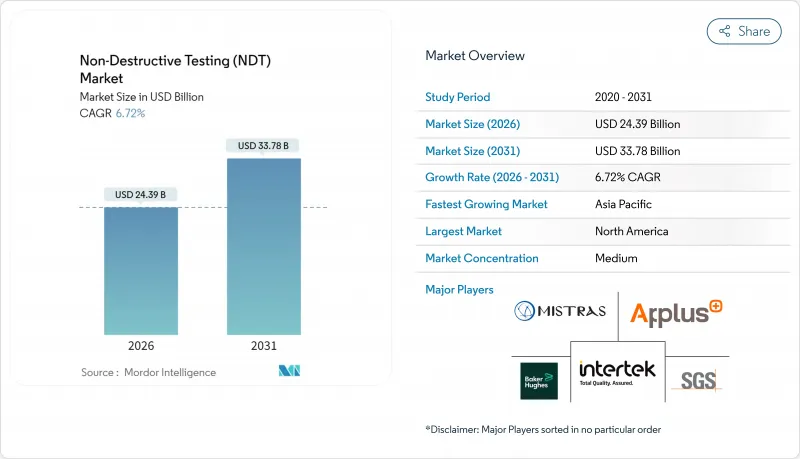
The non-destructive testing market was valued at USD 22.86 billion in 2025 and estimated to grow from USD 24.39 billion in 2026 to reach USD 33.78 billion by 2031, at a CAGR of 6.72% during the forecast period (2026-2031).
Heightened global safety rules, the accelerating replacement of aging assets, and the rapid adoption of AI-enabled diagnostic platforms are shifting non-destructive evaluation from reactive fault finding toward predictive asset management. Regulatory agencies in North America and Europe now mandate more frequent inspections for pressure vessels, pipelines, aircraft structures, and nuclear reactors, anchoring a steady demand floor. Meanwhile, AI-driven analytics shorten inspection cycles, slash data-processing time, and create new subscription revenue streams for software vendors. Service providers are responding by pairing portable phased-array and digital radiography equipment with cloud analytics, raising productivity and lowering total inspection costs. Consolidation through mergers and acquisitions is intensifying, as integrated players seek to bundle hardware, software, and certified labor into turnkey offerings that simplify compliance for end users.
Global Non-Destructive Testing (NDT) Market Trends and Insights
Stricter Safety And Quality Regulations Drive Compliance-Led Growth
Regulatory bodies, such as the American Society of Mechanical Engineers, the Nuclear Regulatory Commission, and the Federal Aviation Administration, updated their codes in 2024, which now require more frequent and comprehensive non-destructive examinations of pressure vessels, reactor components, and composite aircraft parts. These tighter rules have shifted purchasing decisions from discretionary spending to mandatory compliance, guaranteeing baseline demand even in downturns. The mandatory use of phased-array ultrasonics for high-temperature pressure vessels, combined with digital record-keeping rules, is prompting asset owners to modernize their equipment fleets. Service providers benefit from multiyear inspection contracts that improve revenue predictability. Equipment vendors win through accelerated replacement sales and recurring software subscriptions tied to code compliance updates. As additional jurisdictions align with U.S. and European standards, the driver's influence broadens, reinforcing a long-term growth thrust for the non-destructive testing market.
Aging Infrastructure Replacement Cycle Accelerates Inspection Demand
More than 40% of North American bridges now exceed design life, while pipelines installed during the 1960s are approaching critical inspection intervals. Life-extension programs for nuclear plants commissioned in the 1970s require extensive ultrasonic vessel scans to be performed before license renewal. The resulting inspection backlog fuels record demand for high-throughput testing services, intelligent pigging tools, and automated data analytics. Because infrastructure failures carry high social and economic costs, regulators enforce strict inspection calendars that asset owners cannot defer. This secular trend secures long-term visibility for non-destructive testing service revenue and spurs investment in portable equipment that improves site productivity. As Asia-Pacific utilities embark on similar upgrade cycles, global demand curves continue to steepen.
High Cost Of Automated NDT Systems Limits Adoption In Price-Sensitive Markets
Fully automated phased-array scanners can cost USD 200,000-500,000, a price point that strains the budgets of small and mid-sized service firms. Annual calibration, software licensing, and training double the lifetime ownership cost, extending breakeven periods. In emerging markets with lower labor costs, operators often favor manual inspection despite longer cycle times, which slows the penetration of high-margin automated solutions. Smaller vendors lacking capital scale struggle to compete, accelerating market consolidation. Until financing tools or equipment leasing models mature, this restraint will continue to dampen uptake, especially outside high-value energy and aerospace segments.
Other drivers and restraints analyzed in the detailed report include:
- Expansion Of Offshore Oil And Gas Projects Drives Subsea NDT Innovation
- Portable Phased-Array And Digital-Radiography Equipment Uptake Transforms Field Operations
- Shortage Of Certified Technicians Constrains Market Growth Potential
For complete list of drivers and restraints, kindly check the Table Of Contents.
Segment Analysis
Services held 78.90% of 2025 revenue, yet the software slice is forecast to expand at 11.71% CAGR, setting a new value-creation arc for the non-destructive testing market. AI-driven image-recognition engines convert terabytes of scan data into actionable maintenance insights within minutes, reshaping service economics from hourly billing toward outcome-based pricing. Equipment vendors now bundle cloud analytics with hardware, embedding annual subscriptions that stretch revenue beyond the initial sale. The surge in edge-computing modules enables real-time analytics at inspection sites, easing data sovereignty concerns and reducing bandwidth costs.
Software's rise does not eclipse field labor but redefines task allocation. Technicians capture higher-quality data more quickly, while centralized analysts validate AI-generated flags and produce compliance-ready reports. The model trims field overtime, increases fleet utilization, and creates new recurring revenue for platform providers. As regulatory bodies accept digitally signed reports, the non-destructive testing industry gains both speed and auditability, underscoring the pivotal role of software in modern inspection workflows.
Ultrasonic methods accounted for 27.95% of the 2025 non-destructive testing market share, owing to their versatility in inspections of welds, forgings, and composites. Advanced phased-array configurations enable rapid corrosion mapping and volumetric flaw sizing without the need for dismantling equipment. Yet, eddy-current testing is expected to grow at a 9.07% CAGR through 2031, driven by its ability to detect micro-cracks in conductive materials used in aerospace composites and additive-manufactured parts.
Improved probe design and multi-frequency arrays now deliver deeper penetration and faster scanning, challenging ultrasonics' historical stronghold in thin-wall inspections. Meanwhile, digital radiography continues to play a critical role in pipeline weld validation, and magnetic particle testing remains indispensable for detecting surface flaws in ferromagnetic components. Together, these complementary methods ensure that asset owners deploy a balanced toolbox that blends speed, sensitivity, and regulatory acceptance, depending on the defect type and material.
The Global Non-Destructive Testing (NDT) Market Report is Segmented by Component (Equipment, Software, Services, and Consumables), Testing Method (Ultrasonic Testing, Radiographic Testing, Magnetic Particle Testing, and More), Technique (Traditional/Conventional and AI-Enabled), End-User Industry (Oil and Gas, Power Generation, Aerospace, and More), and Geography. The Market Forecasts are Provided in Terms of Value (USD).
Geography Analysis
North America retained a 36.30% share in 2025, driven by mature regulatory oversight, aging infrastructure, and early adoption of AI. The region's large installed base of pressure vessels, pipelines, and aircraft structures ensures steady inspection volumes, while oil and gas operators fund advanced robotic pigging to extend the life of their assets. Government grants supporting nuclear plant life-extension programs also sustain demand for volumetric ultrasonic scanning.
Europe trails slightly, yet benefits from rigorous safety directives and the European Union's push for renewable energy projects under the Green Deal. Wind-turbine blade inspections, composite rotor defect monitoring, and hydrogen pipeline pilots collectively bolster the regional non-destructive testing market. Ongoing upgrades to nuclear reactors in France and the United Kingdom are driving the addition of long-term inspection contracts, while ESG concerns are accelerating the shift from film to digital radiography to reduce hazardous-waste volumes.
The Asia-Pacific region is delivering the strongest forward momentum, with a 7.61% CAGR, driven by massive infrastructure projects in China and India, as well as expanding aerospace and semiconductor manufacturing. Governments in Japan and South Korea align local codes with ASME and IEC standards, thereby raising the rigor of inspections. Emerging Southeast Asian economies often rely on international certifiers for compliance, presenting opportunities for service to global firms. Belt and Road pipeline networks drive demand for intelligent pigging, while new shipyards across the region require magnetic particle and phased-array inspections of large hull welds.
The Middle East and Africa gain from offshore oil and gas investments and petrochemical plant expansions. Subsea projects in the Red Sea and offshore West Africa call for deepwater-qualified inspection technologies. Political instability in certain countries can delay projects, injecting volatility into regional forecasts but also producing premium margins when projects advance under compressed timelines. Latin America records moderate growth, centered on Brazilian pre-salt developments and Mexican refinery upgrades, both of which require high-specification non-destructive examinations.
- Baker Hughes Company
- MISTRAS Group, Inc.
- SGS SA
- Intertek Group plc
- Applus+ Services, S.A.
- Olympus Corporation
- Eddyfi/NDT Inc.
- Yxlon International GmbH
- Magnaflux (Illinois Tool Works Inc.)
- Ashtead Technology Ltd.
- Zetec Inc.
- Sonatest Ltd.
- Bureau Veritas SA
- TUV Rheinland AG
- Element Materials Technology Group Ltd.
- DEKRA SE
- DNV AS
- Acuren Inspection, Inc.
- NDT Global GmbH and Co. KG
- Cygnus Instruments Ltd.
- Sonotron NDT
- Bosello High Technology Srl
- LynX Inspection Inc.
- T.D. Williamson, Inc.
Additional Benefits:
- The market estimate (ME) sheet in Excel format
- 3 months of analyst support
TABLE OF CONTENTS
1 INTRODUCTION
- 1.1 Study Assumptions and Market Definition
- 1.2 Scope of the Study
2 RESEARCH METHODOLOGY
3 EXECUTIVE SUMMARY
4 MARKET LANDSCAPE
- 4.1 Market Overview
- 4.2 Market Drivers
- 4.2.1 Stricter safety and quality regulations
- 4.2.2 Aging infrastructure replacement cycle
- 4.2.3 Expansion of offshore oil and gas projects
- 4.2.4 Portable phased-array and DR equipment uptake
- 4.2.5 AI-powered defect analytics platforms
- 4.2.6 Additive-manufacturing QA requirements
- 4.3 Market Restraints
- 4.3.1 High cost of automated NDT systems
- 4.3.2 Shortage of certified technicians
- 4.3.3 Cyber-security and data-sovereignty barriers
- 4.3.4 ESG pushback on radiography waste
- 4.4 Industry Value Chain Analysis
- 4.5 Impact of Macroeconomic Factors
- 4.6 Regulatory Landscape
- 4.7 Technological Outlook
- 4.8 Porter's Five Forces Analysis
- 4.8.1 Threat of New Entrants
- 4.8.2 Bargaining Power of Suppliers
- 4.8.3 Bargaining Power of Buyers
- 4.8.4 Threat of Substitutes
- 4.8.5 Competitive Rivalry
5 MARKET SIZE AND GROWTH FORECASTS (VALUE)
- 5.1 By Component
- 5.1.1 Equipment
- 5.1.2 Software
- 5.1.3 Services
- 5.1.4 Consumables
- 5.2 By Testing Method
- 5.2.1 Ultrasonic Testing
- 5.2.2 Radiographic Testing
- 5.2.3 Magnetic Particle Testing
- 5.2.4 Liquid Penetrant Testing
- 5.2.5 Visual Inspection Testing
- 5.2.6 Eddy-Current Testing
- 5.2.7 Acoustic Emission Testing
- 5.2.8 Thermography / Infrared Testing
- 5.2.9 Computed Tomography Testing
- 5.3 By Technique
- 5.3.1 Traditional/ Conventional
- 5.3.2 AI-enabled
- 5.4 By End-user Industry
- 5.4.1 Oil and Gas
- 5.4.2 Power Generation
- 5.4.3 Aerospace
- 5.4.4 Defense
- 5.4.5 Automotive and Transportation
- 5.4.6 Manufacturing and Heavy Engineering
- 5.4.7 Construction and Infrastructure
- 5.4.8 Chemical and Petrochemical
- 5.4.9 Marine and Ship Building
- 5.4.10 Electronics and semiconductor
- 5.4.11 Mining
- 5.4.12 Medical Devices
- 5.4.13 Other End-user Industries
- 5.5 By Geography
- 5.5.1 North America
- 5.5.1.1 United States
- 5.5.1.2 Canada
- 5.5.1.3 Mexico
- 5.5.2 South America
- 5.5.2.1 Brazil
- 5.5.2.2 Argentina
- 5.5.2.3 Rest of South America
- 5.5.3 Europe
- 5.5.3.1 Germany
- 5.5.3.2 United Kingdom
- 5.5.3.3 France
- 5.5.3.4 Italy
- 5.5.3.5 Spain
- 5.5.3.6 Rest of Europe
- 5.5.4 Asia-Pacific
- 5.5.4.1 China
- 5.5.4.2 Japan
- 5.5.4.3 India
- 5.5.4.4 South Korea
- 5.5.4.5 South-East Asia
- 5.5.4.6 Rest of Asia-Pacific
- 5.5.5 Middle East and Africa
- 5.5.5.1 Middle East
- 5.5.5.1.1 Saudi Arabia
- 5.5.5.1.2 United Arab Emirates
- 5.5.5.1.3 Turkey
- 5.5.5.1.4 Rest of Middle East
- 5.5.5.2 Africa
- 5.5.5.2.1 South Africa
- 5.5.5.2.2 Nigeria
- 5.5.5.2.3 Rest of Africa
- 5.5.5.1 Middle East
- 5.5.1 North America
6 COMPETITIVE LANDSCAPE
- 6.1 Market Concentration
- 6.2 Strategic Moves
- 6.3 Market Share Analysis
- 6.4 Company Profiles (includes Global level Overview, Market level overview, Core Segments, Financials as available, Strategic Information, Market Rank/Share for key companies, Products and Services, and Recent Developments)
- 6.4.1 Baker Hughes Company
- 6.4.2 MISTRAS Group, Inc.
- 6.4.3 SGS SA
- 6.4.4 Intertek Group plc
- 6.4.5 Applus+ Services, S.A.
- 6.4.6 Olympus Corporation
- 6.4.7 Eddyfi/NDT Inc.
- 6.4.8 Yxlon International GmbH
- 6.4.9 Magnaflux (Illinois Tool Works Inc.)
- 6.4.10 Ashtead Technology Ltd.
- 6.4.11 Zetec Inc.
- 6.4.12 Sonatest Ltd.
- 6.4.13 Bureau Veritas SA
- 6.4.14 TUV Rheinland AG
- 6.4.15 Element Materials Technology Group Ltd.
- 6.4.16 DEKRA SE
- 6.4.17 DNV AS
- 6.4.18 Acuren Inspection, Inc.
- 6.4.19 NDT Global GmbH and Co. KG
- 6.4.20 Cygnus Instruments Ltd.
- 6.4.21 Sonotron NDT
- 6.4.22 Bosello High Technology Srl
- 6.4.23 LynX Inspection Inc.
- 6.4.24 T.D. Williamson, Inc.
7 MARKET OPPORTUNITIES AND FUTURE OUTLOOK
- 7.1 White-space and Unmet-need Assessment

