
PUBLISHER: Mordor Intelligence | PRODUCT CODE: 1907235

PUBLISHER: Mordor Intelligence | PRODUCT CODE: 1907235
Limestone - Market Share Analysis, Industry Trends & Statistics, Growth Forecasts (2026 - 2031)
Limestone market size in 2026 is estimated at 5.58 Billion tons, growing from 2025 value of 5.38 Billion tons with 2031 projections showing 6.71 Billion tons, growing at 3.76% CAGR over 2026-2031.
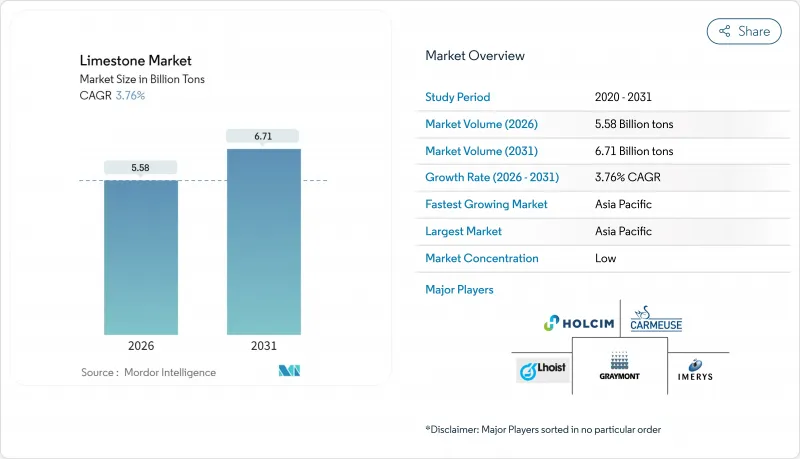
This steady rise is anchored in limestone's irreplaceable role in steel flux, cement clinker, flue-gas desulfurization (FGD), and emerging carbon-removal technologies. Industrial lime applications continue to dominate volume demand as steelmakers shift to hydrogen-based direct-reduction processes that consume more flux per ton of output. Construction activity in emerging Asia, stricter environmental regulations in coal-reliant economies, and premium-grade demand from direct-air-capture pilots add further momentum. Competitive activity centers on acquisitions that secure long-life quarries and integrate downstream processing, while tightening quarry permits and rising carbon-tax exposure shape cost structures.
Global Limestone Market Trends and Insights
Construction Super-cycle in Emerging Asia Drives Bulk Limestone Demand
Accelerated infrastructure programs across India, Indonesia, Vietnam, and Cambodia keep cement kilns running near nameplate capacity, raising limestone pull-through because the mineral accounts for roughly 80% of cement feedstock. The short haul radius that quarry stone can travel economically, typically less than 200 km, concentrates supply risk near large urban projects. Nevertheless, abundant reserves in Rajasthan, Odisha, and Andhra Pradesh continue to anchor India's cost advantage.
Steel-intensive Energy-transition Projects Boost Flux Consumption
Wind-turbine foundations require 200-400 tons of steel per megawatt, driving parallel limestone demand because steel flux rates in basic-oxygen and electric-arc furnaces rise as operators chase cleaner chemistries. Hydrogen-based direct-reduction iron (DRI-H2) flowsheets consume 15-20% more flux to manage increased gangue pickup, while solar-grade glass for utility-scale photovoltaics needs limestone-derived soda-lime silicates at 3-4 tons per megawatt. Global renewables expansion toward 11,000 GW by 2030 therefore keeps industrial lime volumes growing even as steel shifts to low-carbon pathways.
Quarry-footprint and Biodiversity Litigation Tighten Operating Licenses
Ontario's Aggregate Resources Act now requires multi-year ecological baselines, water-table modeling, and post-closure rehabilitation guarantees that lift pre-production costs by 8-12% of life-of-mine capital. Similar hurdles in Queensland and California extend approval cycles beyond two years, pressuring smaller operators to consolidate or divest. Water-abstraction permits, such as Longcliffe's request to boost intake to 350,000 m3/year, face public consultation and environmental scrutiny that add time and cost. Deposits situated in habitat-rich areas thus face rising legal risks, restricting supply of premium stone grades.
Other drivers and restraints analyzed in the detailed report include:
- Desulfurization Environmental Mandates in Coal-heavy Economies
- Ultra-fine CaCO3 in Bio-based Plastics
- High Process CO2 from Lime Kilns Invites Carbon-tax Exposure
For complete list of drivers and restraints, kindly check the Table Of Contents.
Segment Analysis
Industrial lime held 65.92% of limestone market share in 2025. Intensifying hydrogen-DRI trials in the EU and the U.S. underpin a 4.02% CAGR outlook, ensuring industrial lime remains the anchor of the limestone market through 2031. Chemical lime follows at mid-single-digit growth, fueled by stricter wastewater norms and sulfur-capture mandates in Asia. Construction lime volumes stay flat as alternative binders gain traction, while refractory grades show niche expansion tied to electric-arc furnace ladle linings.
Long-term supply contracts between integrated steel mills and quarry owners stabilize cash flow, insulating the largest miners from cyclical spot swings. Players such as Lhoist have signed memoranda with green-steel developers to deliver certified low-carbon lime, leveraging vertical partnerships to hedge against carbon taxes.
The Limestone Report is Segmented by Application (Industry Lime, Chemical Lime, Construction Lime, and Refractory Lime), End-User Industry (Paper and Pulp, Water Treatment, Agriculture, Plastics, Building and Construction, and More), and Geography (Asia-Pacific, North America, Europe, South America, and Middle-East and Africa). The Market Forecasts are Provided in Terms of Volume (Tons),
Geography Analysis
Asia-Pacific accounted for 71.62% of global limestone market share in 2025 and is poised for a 4.49% CAGR through 2031. Abundant on-shore deposits in Rajasthan, Guangxi, and Java keep delivered-cost curves low despite rising diesel prices. Southeast Asian governments mandate FGD retrofits on coal plants, adding specialized limestone demand that local quarries in Vietnam's Ha Nam and Indonesia's South Sumatra have begun to supply.
North America and Europe offer smaller volumes but higher value, driven by downstream decarbonization technologies. Graymont's rebrand toward "calcium-based solutions" and Carmeuse's CO2 road-map position regional leaders for DAC supply contracts and Portland Limestone Cement expansions.
The Middle East and Africa register accelerating limestone market growth as Saudi Arabia expands quarry licensing to feed giga-projects and Egypt positions itself as a GCC supplier of precipitated calcium carbonate. South America's trajectory hinges on Brazil's infrastructure stimulus and Argentina's political stability. Indonesian state-backed producer Semen Baturaja posted record 2024 earnings, reflecting strong domestic cement pull.
- ARGOS
- CALCO-BOLIVIA
- Caleras San Juan
- CALIDRA
- Calizas Huayco SA
- CALMOSCORP
- Calpar Limestone Trading Ltd.
- Carmeuse
- GCCP Resources Limited
- Graymont Limited
- Gujarat Mineral Development Corporation Ltd.
- Holcim
- Imerys
- J.M. Huber Corporation
- Lhoist
- Longcliffe Quarries Ltd
- Minerals Technologies Inc
- Nittetsu Mining Co. Ltd
- Okutama Kogyo Co. Ltd
- Omya AG
- SCHAEFER KALK GmbH Co. and AG
Additional Benefits:
- The market estimate (ME) sheet in Excel format
- 3 months of analyst support
TABLE OF CONTENTS
1 Introduction
- 1.1 Study Assumptions and Market Definition
- 1.2 Scope of the Study
2 Research Methodology
3 Executive Summary
4 Market Landscape
- 4.1 Market Overview
- 4.2 Market Drivers
- 4.2.1 Construction super-cycle in emerging Asia drives bulk limestone demand
- 4.2.2 Steel-intensive energy-transition projects (wind, solar, H2) boost flux consumption
- 4.2.3 Desulfurisation and other environmental mandates in coal-heavy economies
- 4.2.4 Direct air/ocean CO2 mineralisation pilots using high-grade limestone
- 4.2.5 Bio-based plastic master-batchers adopt ultra-fine CaCO3 filler grades
- 4.3 Market Restraints
- 4.3.1 Quarrying footprint and biodiversity litigation tighten operating licences
- 4.3.2 High process CO2 from lime kilns invites carbon-tax exposure
- 4.3.3 Engineered stone and geopolymer cement cannibalise decorative and OPC demand
- 4.4 Value Chain Analysis
- 4.5 Porter's Five Forces
- 4.5.1 Bargaining Power of Suppliers
- 4.5.2 Bargaining Power of Buyers
- 4.5.3 Threat of New Entrants
- 4.5.4 Threat of Substitutes
- 4.5.5 Degree of Competition
- 4.6 Import-Export Trends
- 4.7 Price Trends
5 Market Size and Growth Forecasts (Volume and Value)
- 5.1 By Application
- 5.1.1 Industry Lime
- 5.1.2 Chemical Lime
- 5.1.3 Construction Lime
- 5.1.4 Refractory Lime
- 5.2 By End-User Industry
- 5.2.1 Paper and Pulp
- 5.2.2 Water Treatment
- 5.2.3 Agriculture
- 5.2.4 Plastics
- 5.2.5 Building and Construction
- 5.2.6 Steel Manufacturing and Other Industries (Including Energy)
- 5.2.7 Other End-user Industries
- 5.3 By Geography
- 5.3.1 Asia-Pacific
- 5.3.1.1 China
- 5.3.1.2 India
- 5.3.1.3 Japan
- 5.3.1.4 South Korea
- 5.3.1.5 ASEAN
- 5.3.1.6 Rest of Asia-Pacific
- 5.3.2 North America
- 5.3.2.1 United States
- 5.3.2.2 Canada
- 5.3.2.3 Mexico
- 5.3.3 Europe
- 5.3.3.1 Germany
- 5.3.3.2 United Kingdom
- 5.3.3.3 France
- 5.3.3.4 Italy
- 5.3.3.5 Spain
- 5.3.3.6 Nordic Countries
- 5.3.3.7 Russia
- 5.3.3.8 Rest of Europe
- 5.3.4 South America
- 5.3.4.1 Brazil
- 5.3.4.2 Argentina
- 5.3.4.3 Colombia
- 5.3.5 Middle-East and Africa
- 5.3.5.1 Saudi Arabia
- 5.3.5.2 South Africa
- 5.3.5.3 Rest of Middle-East and Africa
- 5.3.1 Asia-Pacific
6 Competitive Landscape
- 6.1 Market Concentration
- 6.2 Strategic Moves
- 6.3 Market Share (%)/Ranking Analysis
- 6.4 Company Profiles (includes Global level Overview, Market level overview, Core Segments, Financials as available, Strategic Information, Market Rank/Share for key companies, Products and Services, and Recent Developments)
- 6.4.1 ARGOS
- 6.4.2 CALCO-BOLIVIA
- 6.4.3 Caleras San Juan
- 6.4.4 CALIDRA
- 6.4.5 Calizas Huayco SA
- 6.4.6 CALMOSCORP
- 6.4.7 Calpar Limestone Trading Ltd.
- 6.4.8 Carmeuse
- 6.4.9 GCCP Resources Limited
- 6.4.10 Graymont Limited
- 6.4.11 Gujarat Mineral Development Corporation Ltd.
- 6.4.12 Holcim
- 6.4.13 Imerys
- 6.4.14 J.M. Huber Corporation
- 6.4.15 Lhoist
- 6.4.16 Longcliffe Quarries Ltd
- 6.4.17 Minerals Technologies Inc
- 6.4.18 Nittetsu Mining Co. Ltd
- 6.4.19 Okutama Kogyo Co. Ltd
- 6.4.20 Omya AG
- 6.4.21 SCHAEFER KALK GmbH Co. and AG
7 Market Opportunities and Future Outlook
- 7.1 White-space and Unmet-Need Assessment

