
PUBLISHER: Mordor Intelligence | PRODUCT CODE: 1907252

PUBLISHER: Mordor Intelligence | PRODUCT CODE: 1907252
Hyperspectral Imaging - Market Share Analysis, Industry Trends & Statistics, Growth Forecasts (2026 - 2031)
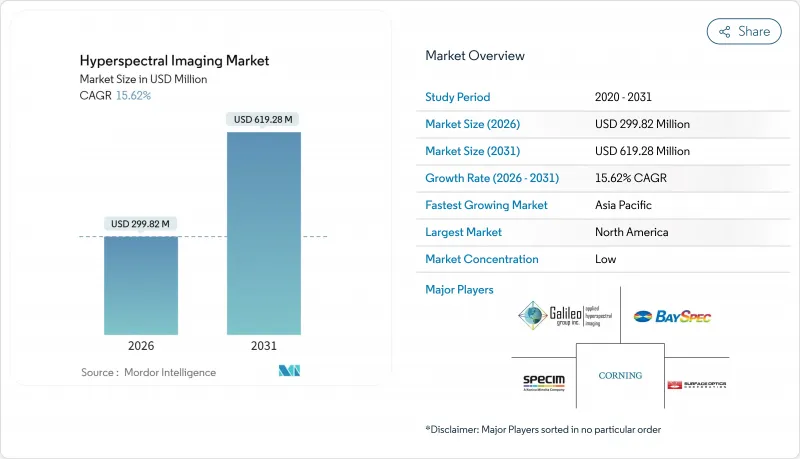
The hyperspectral imaging market size in 2026 is estimated at USD 299.82 million, growing from 2025 value of USD 259.30 million with 2031 projections showing USD 619.28 million, growing at 15.62% CAGR over 2026-2031.
This expansion rests on falling VNIR/SWIR sensor prices, Defense Department contracts for space-borne constellations, and policy-backed precision-agriculture roll-outs across Asia Pacific. Vendors now embed machine-learning accelerators inside detectors, enabling in-field analytics that eliminate bulky workstations and shorten decision cycles to milliseconds. At the same time, miniaturized snapshot cameras shrink size, weight, and power by two orders of magnitude, opening consumer channels such as smartphone diagnostics. Program funding that exceeds USD 1.3 billion for U.S. government HSI missions guarantees recurring demand and accelerates spillover of defense-grade technology into civilian applications.
Global Hyperspectral Imaging Market Trends and Insights
Integration of AI-based on-chip analytics
Edge neural networks now reside directly on detector arrays, pushing real-time throughput beyond 1.2 Tb/s. The U.S. Army's HyperThreAD program demonstrates chemical threat recognition in seconds from UAV-borne cameras. These advances cut latency, reduce bandwidth loads, and enable autonomous quality decisions in agricultural sorters, recycling robots, and industrial process lines. Broader commercial use is accelerating as thin-film filter stacks from Imec allow CMOS-level manufacturing, dropping unit costs while raising frame rates. As a result, AI-enabled detectors are poised to form the core of next-generation autonomous platforms in logistics, mining, and food safety.
Rapid cost erosion of VNIR/SWIR sensors
InGaAs wafer yields have doubled since 2024, and shared back-end packaging lines now mimic smartphone camera economics, pushing average selling prices down nearly 40% per year. Cost parity with mid-range CMOS imagers is expected by 2027, moving hyperspectral cameras from capital expense to consumable tool in many production lines. UC Davis compressive-sensing prototypes cut optics mass by 100X without spectral fidelity loss, reinforcing this deflationary trend. As prices retreat, the hyperspectral imaging market gains traction in automotive paint inspection, electronics failure analysis, and industrial metrology.
Persistent calibration drift
Temperature swings, vibration, and airborne contaminants degrade spectral alignment by more than 2% per month in unconditioned factories. While LED-based self-calibrators keep high-end airborne payloads within 5% uncertainty, their USD 50,000 price tag restricts use to premium systems. Budget units in food sorting and recycling plants still require weekly validation, disrupting workflows and lowering confidence among operators. Vendors that integrate sealed optics, on-board references, and adaptive algorithms are positioned to capture share as users seek maintenance-free uptime.
Other drivers and restraints analyzed in the detailed report include:
- Expanding precision-agriculture programs in APAC
- DoD/DARPA funding for space-borne hyperspectral constellations
- High CAPEX and data-storage costs
For complete list of drivers and restraints, kindly check the Table Of Contents.
Segment Analysis
The cameras segment captured 50.40% of the hyperspectral imaging market share in 2025, while service providers grew the fastest at a 16.05% CAGR. Turnkey models bundle sensor rental, flight operations, and spectral analytics, sparing end-users from steep learning curves. Headwall Photonics' alliance with GRYFN exemplifies this managed-service pivot, pairing UAV payloads with cloud-native dashboards. Regulatory audits in defense and mining increasingly stipulate certified providers, reinforcing the segment's momentum. System integrators sustain demand by customizing optics and illumination for machine-vision retrofits. QinetiQ US, for instance, curates spectral libraries for surveillance and environmental missions, monetizing software updates and data services over multiyear contracts
Pushbroom scanners captured 61.20% of hyperspectral imaging market share in 2025 thanks to high SNR across long dwell times. Mining surveys and satellite payloads rely on the line-scan method's uniform illumination and spectral fidelity. Snapshot imagers, however, posted a 16.35% CAGR, capturing full data cubes in a single frame and enabling handheld, jitter-free operation for field agronomy and medical endoscopy.
Hybrid innovations such as Specim's FX-series thermal pushbroom camera marry mid-wave coverage with mechanical scanning to serve industrial furnaces and flare monitoring. Tunable-filter rigs address chemical sensing where selective bands suffice, while whiskbroom architectures retain relevance on high-altitude platforms demanding pinpoint targeting.
The Hyperspectral Imaging Market Report is Segmented by Offering (Cameras, System Integrator, and Service Provider), Technology (Pushbroom, Snapshot, Tunable Filter, and More), Wavelength (Visible and NIR, SWIR, MWIR, and More), End-User Industry (Food and Agriculture, Healthcare, Defense, Mining and Metrology and More), and Geography (North America, Europe, and More). The Market Forecasts are Provided in Terms of Value (USD).
Geography Analysis
North America led with 37.50% hyperspectral imaging market size in 2025, driven by strong defense allocations, NIH-funded medical imaging grants, and robust venture capital for dual-use space companies. Federal five-year imagery contracts guarantee steady revenue streams, while Silicon Valley startups tap USD 24 million-plus Series A rounds to build low-Earth-orbit constellations. Cross-border collaboration with Canada on Arctic monitoring generates incremental sensor orders and data-processing services.
Asia Pacific posts the fastest expansion at 16.6% CAGR, propelled by China's Digital Village Initiative and India's agri-tech subsidies, both mandating real-time crop-health reporting. Regional semiconductor clusters around Suzhou, Hsinchu, and Osaka shorten lead times and compress costs, letting local drone integrators bundle spectral payloads below USD 10,000. Governments also field-test HSI for river-pollution tracking and rare-earth exploration, adding multi-year pipeline visibility.
Europe maintains balanced growth anchored in circular-economy regulations. The EU target of 65% municipal-waste recycling by 2030 creates a stable pull for optical sorters, while ESA-backed Copernicus expansion funds hyperspectral satellite services. Germany champions industrial automation, France focuses on vineyard disease prediction, and Nordic countries leverage HSI for timber-quality grading. Regional data-sovereignty rules stimulate local cloud providers to offer compliant analytics stacks, reinforcing domestic value retention.
- Galileo Group, Inc.
- BaySpec Inc.
- Specim Spectral Imaging Ltd
- Corning Incorporated
- Surface Optics Corporation
- Headwall Photonics Inc.
- Resonon Inc.
- HyperMed Imaging Inc.
- Norsk Elektro Optikk AS
- Cubert GmbH
- XIMEA GmbH
- HinaLea Imaging (TruTag Technologies Inc.)
- ITRES Research Limited
- Telops Inc.
- Brimrose Corporation of America
- Teledyne DALSA Inc.
- ClydeHSI Ltd.
- ChemImage Corporation
- Diaspective Vision GmbH
- Applied Spectral Imaging Inc.
Additional Benefits:
- The market estimate (ME) sheet in Excel format
- 3 months of analyst support
TABLE OF CONTENTS
1 INTRODUCTION
- 1.1 Study Assumptions and Market Definition
- 1.2 Scope of the Study
2 RESEARCH METHODOLOGY
3 EXECUTIVE SUMMARY
4 MARKET LANDSCAPE
- 4.1 Market Overview
- 4.2 Market Drivers
- 4.2.1 Integration of AI-based on-chip analytics
- 4.2.2 Rapid cost erosion of VNIR/SWIR sensors
- 4.2.3 Expanding precision-agriculture programs in APAC
- 4.2.4 DoD/DARPA funding for space-borne HSI constellations
- 4.2.5 Miniaturized snapshot HSI for smartphone diagnostics
- 4.2.6 Mandatory ESG disclosure driving mineral-grade verification
- 4.3 Market Restraints
- 4.3.1 Persistent calibration drift in field-deployable units
- 4.3.2 High CAPEX and data-storage costs
- 4.3.3 US-China export-control regimes on sensor cores
- 4.3.4 Scarcity of domain-specific spectral libraries
- 4.4 Patent Analysis
- 4.5 Technology Snapshot - Applications
- 4.5.1 Surveillance
- 4.5.2 Remote Sensing
- 4.5.3 Machine Vision/Optical
- 4.5.4 Medical Diagnostics/Research
- 4.6 Industry Value Chain Analysis
- 4.7 Regulatory Landscape
- 4.8 Porter's Five Forces Analysis
- 4.8.1 Bargaining Power of Suppliers
- 4.8.2 Bargaining Power of Buyers
- 4.8.3 Threat of New Entrants
- 4.8.4 Threat of Substitutes
- 4.8.5 Intensity of Competitive Rivalry
- 4.9 Assessment of Macro-economic Trends on the Market
5 MARKET SIZE AND GROWTH FORECASTS (VALUE)
- 5.1 By Offering
- 5.1.1 Cameras
- 5.1.2 System Integrator
- 5.1.3 Service Provider
- 5.2 By Technology
- 5.2.1 Pushbroom
- 5.2.2 Snapshot
- 5.2.3 Tunable Filter
- 5.2.4 Imaging FTIR
- 5.2.5 Whiskbroom
- 5.3 By Wavelength
- 5.3.1 Visible and NIR (Near-Infrared)
- 5.3.2 SWIR (Short-Wave Infrared)
- 5.3.3 MWIR (Mid-Wave Infrared)
- 5.3.4 LWIR (Long-Wave Infrared)
- 5.4 By End-user Industry
- 5.4.1 Food and Agriculture
- 5.4.2 Healthcare
- 5.4.3 Defense
- 5.4.4 Mining and Metrology
- 5.4.5 Recycling
- 5.4.6 Other End-user Industries
- 5.5 By Geography
- 5.5.1 North America
- 5.5.1.1 United States
- 5.5.1.2 Canada
- 5.5.1.3 Mexico
- 5.5.2 South America
- 5.5.2.1 Brazil
- 5.5.2.2 Argentina
- 5.5.2.3 Rest of South America
- 5.5.3 Europe
- 5.5.3.1 Germany
- 5.5.3.2 United Kingdom
- 5.5.3.3 France
- 5.5.3.4 Italy
- 5.5.3.5 Spain
- 5.5.3.6 Rest of Europe
- 5.5.4 Asia Pacific
- 5.5.4.1 China
- 5.5.4.2 Japan
- 5.5.4.3 India
- 5.5.4.4 South Korea
- 5.5.4.5 ASEAN
- 5.5.4.6 Rest of Asia Pacific
- 5.5.5 Middle East and Africa
- 5.5.5.1 Middle East
- 5.5.5.1.1 Saudi Arabia
- 5.5.5.1.2 United Arab Emirates
- 5.5.5.1.3 Rest of Middle East
- 5.5.5.2 Africa
- 5.5.5.2.1 South Africa
- 5.5.5.2.2 Egypt
- 5.5.5.2.3 Rest of Africa
- 5.5.5.1 Middle East
- 5.5.1 North America
6 COMPETITIVE LANDSCAPE
- 6.1 Market Concentration
- 6.2 Strategic Moves
- 6.3 Market Share Analysis
- 6.4 Company Profiles (includes Global level Overview, Market level overview, Core Segments, Financials as available, Strategic Information, Market Rank/Share for key companies, Products & Services, and Recent Developments)
- 6.4.1 Galileo Group, Inc.
- 6.4.2 BaySpec Inc.
- 6.4.3 Specim Spectral Imaging Ltd
- 6.4.4 Corning Incorporated
- 6.4.5 Surface Optics Corporation
- 6.4.6 Headwall Photonics Inc.
- 6.4.7 Resonon Inc.
- 6.4.8 HyperMed Imaging Inc.
- 6.4.9 Norsk Elektro Optikk AS
- 6.4.10 Cubert GmbH
- 6.4.11 XIMEA GmbH
- 6.4.12 HinaLea Imaging (TruTag Technologies Inc.)
- 6.4.13 ITRES Research Limited
- 6.4.14 Telops Inc.
- 6.4.15 Brimrose Corporation of America
- 6.4.16 Teledyne DALSA Inc.
- 6.4.17 ClydeHSI Ltd.
- 6.4.18 ChemImage Corporation
- 6.4.19 Diaspective Vision GmbH
- 6.4.20 Applied Spectral Imaging Inc.
7 MARKET OPPORTUNITIES AND FUTURE OUTLOOK
- 7.1 White-space and Unmet-Need Assessment

