
PUBLISHER: Mordor Intelligence | PRODUCT CODE: 1907284

PUBLISHER: Mordor Intelligence | PRODUCT CODE: 1907284
Plastic Bottles And Containers - Market Share Analysis, Industry Trends & Statistics, Growth Forecasts (2026 - 2031)
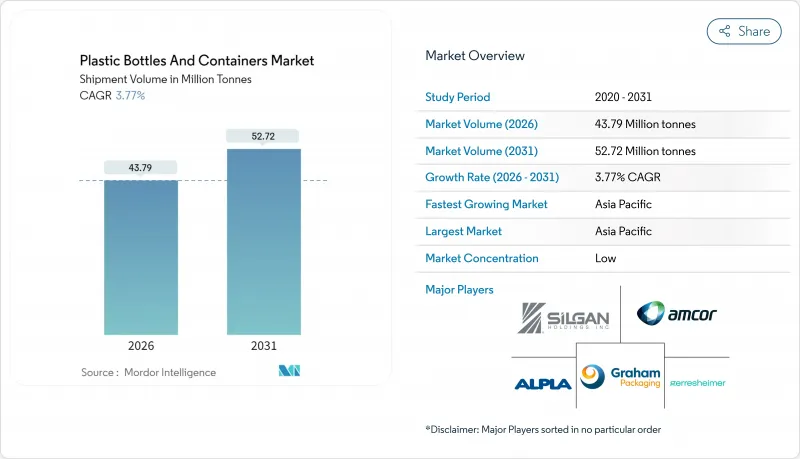
The plastic bottles and containers market size in 2026 is estimated at 43.79 million tonnes, growing from 2025 value of 42.2 million tonnes with 2031 projections showing 52.72 million tonnes, growing at 3.77% CAGR over 2026-2031.
Robust demand from the beverages, household care, and pharmaceuticals sectors sustains baseline growth, while regulation-driven targets for recycled content accelerate material innovation. PET's dominance, lightweighting efforts that cut container weight by 15-20%, and a sharp focus on logistics-ready designs for e-commerce signal an industry pivot toward efficiency and circularity. Consolidation, exemplified by Amcor's all-stock merger with Berry Global, augments vertical integration around rPET sourcing and advanced recycling. At the same time, moderate market concentration leaves ample room for regional specialists and bio-based disruptors to carve out high-margin niches.
Global Plastic Bottles And Containers Market Trends and Insights
Rising Demand for Lightweight, Shatter-Resistant Packaging
Brands reduce logistics costs and emissions by trimming wall thickness yet preserving strength. PureCycle's ultra-pure recycled PP resin supports 15-20% weight cuts without compromising rigidity. Such lightweight containers excel in e-commerce, where multiple handling points raise breakage risks. The FDA's aseptic guidelines endorse these formats for shelf-stable foods, further validating adoption. Suppliers now pair finite-element design software with high-flow resins to create intricate ribs that boost top-load resistance, giving converters a clear ROI path.
Cost Advantage and Scalability of PET/HDPE
PET and HDPE retain a cost edge through high-volume injection stretch blow molding cells capable of 100,000 units hourly. Established feedstock networks temper resin price swings, while chemical-recycling pilots from Dow and others aim to decouple supply from virgin petrochemicals. HDPE's chemical inertness secures detergent and pharmaceutical demand, shielding it from rapid substitution. Automated material-handling silos and inline color-dosage systems further shave labor and scrap costs, ensuring competitive per-unit economics.
Single-Use-Plastic Bans and Taxes
Germany's Single-Use Plastic Fund Act levies manufacturer fees tied to container weight, prompting cost pass-throughs and recipe changes. Spain enforces a EUR 0.45 kg (USD 0.49 kg) tax on virgin polymer, while the United Kingdom imposes duties on packaging with under 30% recycled content. These fiscal tools compress margins for legacy formats and redirect capital to rPET and refill schemes. Compliance tracking elevates administrative overhead, especially for SMEs operating across multiple jurisdictions.
Other drivers and restraints analyzed in the detailed report include:
- Surge in E-commerce Logistics
- Brand Circularity Push for rPET
- Shift to Aluminum and Paper Alternatives
For complete list of drivers and restraints, kindly check the Table Of Contents.
Segment Analysis
PET held 61.73% of the plastic bottles and containers market share in 2025 and is expanding at a 4.01% CAGR. That scale generates economies that continually compress cost-per-unit even as resin prices fluctuate. The plastic bottles and containers market size attributable to PET applications is projected to add 5.05 million tonnes by 2031, supported by mandatory recycled-content thresholds in the European Union and Canada. HDPE follows as a durable incumbent for bleach, detergent, and OTC medications, but lower collection rates hinder its circular momentum. LDPE and PP fill clarity- and heat-resistant niches, while bio-based polyhydroxyalkanoate (PHA) resins inch toward commercial volume thanks to brand pilot programs. Carbios' 50,000 tonne biorecycling plant, scheduled for 2026 start-up, underpins PET's circular flywheel by feeding high-purity rPET back into beverage loops.
In the longer term, enzymatic and solvent-based recycling promise feedstock flexibility that preserves color and mechanical performance, positioning PET to defend share even against composite paper bottles. Investors, therefore, channel capital into depolymerization reactors and flake-washing lines that secure brand off-take agreements. However, emerging extended producer responsibility fees favor material diversification, creating space for niche bio-based players to capture high-margin SKUs in cosmetics and nutraceuticals.
Injection blow molding delivered 47.62% of 2025 volume through repeatability and thin-wall capability, anchoring small-format bottles for pharmaceuticals and travel-size personal care. Yet extrusion blow molding is tracking a 4.36% CAGR, underpinned by its superior per-cavity output in large-volume containers. As the plastic bottles and containers market size tied to household and industrial cleaners grows across the Asia Pacific, extrusion lines capable of 25 kg hourly throughput become the converter's workhorse. Stretch blow molding, critical for sparkling beverages, continues to benefit from neck-finish lightweighting that saves 1-2 g per bottle and aggregates millions in resin savings annually.
Automation advances blur process boundaries: hybrid lines that marry injection-molded preforms with in-line extrusion overlay enable multilayer oxygen-barrier bottles, catering to premium cold-brew coffee. Rapid-change mold plates reduce downtime, letting contract packers switch SKUs quickly in response to on-demand personalized labeling trends. Even so, injection platforms retain an edge where dimensional tolerances below +-0.05 mm are mandatory.
The Plastic Bottles and Containers Market Report is Segmented by Material (Polyethylene Terephthalate (PET), High-Density Polyethylene (HDPE), and More), Manufacturing Process (Extrusion Blow Molding, Injection Blow Molding, and More), Capacity Range (Less Than 100 ML, 100 - 250 ML, and More), End-User Vertical (Beverages, Food, and More), and Geography. The Market Forecasts are Provided in Terms of Volume (Tonnes).
Geography Analysis
Asia Pacific controlled 49.62% of 2025 shipments, adding 4.49% CAGR as rising urban incomes in India and Southeast Asia lift per-capita beverage and personal-care consumption. China, already home to the world's largest PET resin capacity, channels investment into rPET flake lines co-located with mega-bottling hubs, shrinking logistic costs, and Scope 3 emissions. India's push for 20% ethanol blending in petrol elevates demand for HDPE AdBlue containers, further boosting regional volume. Japan and South Korea champion precision stretch-blow technologies, licensing these to ASEAN converters and exporting high-margin mold sets.
Europe wields regulatory muscle that shapes global standards. The EU directive mandating 30% recycled content in single-use beverage bottles by 2030 has already spurred deposit-return schemes that lifted regional PET collection to 27 kg per capita in 2024. Germany's Green Dot fees, indexed to recycled content, incentivize design-for-recycling bottle geometries. France pilots digital product passports, requiring unique container IDs that feed state carbon registries and guide eco-modulation of waste fees.
North America blends voluntary brand pledges with emerging state-level mandates. California's SB 343 dictates truth-in-recycling labeling, forcing material data transparency. The United States recycled 29.1% of PET bottles in 2024, underscoring a sizable recovery gap relative to Europe. Canada's 50% recycled-content goal for 2030 accelerates investments in wash-flake capacity near Toronto and Vancouver. Mexico, meanwhile, leverages low labor costs to attract contract blow molders supplying regional beverage giants, positioning itself as a pivotal nearshore hub.
- Amcor plc
- ALPLA Group
- Graham Packaging Company
- Silgan Holdings Inc.
- Gerresheimer AG
- Greiner Packaging International GmbH
- Resilux NV
- Altium Packaging LLC
- Retal Industries Ltd.
- Nampak Ltd.
- Comar LLC
- Alpha Packaging Pvt. Ltd.
- Plastipak Holdings Inc.
- Pretium Packaging LLC
- CoastPak Industrial Co. Ltd.
- Grief, Inc.
- O.Berk Company, LLC
- Mauser Packaging Solutions Holding Company
- Richards Glass Co. Ltd.
- Triumbari Corp.
Additional Benefits:
- The market estimate (ME) sheet in Excel format
- 3 months of analyst support
TABLE OF CONTENTS
1 INTRODUCTION
- 1.1 Study Assumptions and Market Definition
- 1.2 Scope of the Study
2 RESEARCH METHODOLOGY
3 EXECUTIVE SUMMARY
4 MARKET LANDSCAPE
- 4.1 Market Overview
- 4.2 Market Drivers
- 4.2.1 Rising demand for lightweight, shatter-resistant packaging
- 4.2.2 Cost advantage and scalability of PET/HDPE
- 4.2.3 Surge in e-commerce logistics
- 4.2.4 Brand circularity push for rPET (under-the-radar)
- 4.2.5 EU tethered-cap regulation-driven volumes (under-the-radar)
- 4.2.6 Aseptic cold-fill for dairy-alternatives (under-the-radar)
- 4.3 Market Restraints
- 4.3.1 Single-use-plastic bans and taxes
- 4.3.2 Shift to aluminum and paper alternatives
- 4.3.3 Volatile PCR resin supply (under-the-radar)
- 4.3.4 Lightweight glass tech eroding weight edge (under-the-radar)
- 4.4 Industry Supply-Chain Analysis
- 4.5 Regulatory Landscape
- 4.6 Technological Outlook
- 4.7 Porter's Five Forces Analysis
- 4.7.1 Bargaining Power of Suppliers
- 4.7.2 Bargaining Power of Buyers
- 4.7.3 Threat of New Entrants
- 4.7.4 Threat of Substitutes
- 4.7.5 Intensity of Competitive Rivalry
- 4.8 Investment Analysis
- 4.9 Assessment of Geopolitical Developments
5 MARKET SIZE AND GROWTH FORECASTS (VOLUME)
- 5.1 By Material
- 5.1.1 Polyethylene Terephthalate (PET)
- 5.1.2 High-density Polyethylene (HDPE)
- 5.1.3 Low-density Polyethylene (LDPE)
- 5.1.4 Polypropylene (PP)
- 5.1.5 Bio-based and Compostable Plastics
- 5.1.6 Other Materials
- 5.2 By Manufacturing Process
- 5.2.1 Extrusion Blow Molding
- 5.2.2 Injection Blow Molding
- 5.2.3 Stretch Blow Molding
- 5.2.4 Other Manufacturing Processes
- 5.3 By Capacity Range
- 5.3.1 Less than 100 mL
- 5.3.2 100 - 250 mL
- 5.3.3 251 - 500 mL
- 5.3.4 501 - 1,000 mL
- 5.3.5 More than 1,000 mL
- 5.4 By End-user Vertical
- 5.4.1 Beverages
- 5.4.2 Food
- 5.4.3 Cosmetics and Personal Care
- 5.4.4 Pharmaceuticals
- 5.4.5 Household Care
- 5.4.6 Other End-user Verticals
- 5.5 By Geography
- 5.5.1 North America
- 5.5.1.1 United States
- 5.5.1.2 Canada
- 5.5.1.3 Mexico
- 5.5.2 South America
- 5.5.2.1 Brazil
- 5.5.2.2 Argentina
- 5.5.2.3 Chile
- 5.5.2.4 Rest of South America
- 5.5.3 Europe
- 5.5.3.1 United Kingdom
- 5.5.3.2 Germany
- 5.5.3.3 France
- 5.5.3.4 Italy
- 5.5.3.5 Spain
- 5.5.3.6 Russia
- 5.5.3.7 Rest of Europe
- 5.5.4 Asia Pacific
- 5.5.4.1 China
- 5.5.4.2 India
- 5.5.4.3 Japan
- 5.5.4.4 South Korea
- 5.5.4.5 Australia
- 5.5.4.6 Malaysia
- 5.5.4.7 Rest of Asia Pacific
- 5.5.5 Middle East and Africa
- 5.5.5.1 Middle East
- 5.5.5.1.1 Saudi Arabia
- 5.5.5.1.2 United Arab Emirates
- 5.5.5.1.3 Turkey
- 5.5.5.1.4 Rest of Middle East
- 5.5.5.2 Africa
- 5.5.5.2.1 South Africa
- 5.5.5.2.2 Nigeria
- 5.5.5.2.3 Rest of Africa
- 5.5.5.1 Middle East
- 5.5.1 North America
6 COMPETITIVE LANDSCAPE
- 6.1 Market Concentration
- 6.2 Strategic Moves
- 6.3 Market Share Analysis
- 6.4 Company Profiles (includes Global level Overview, Market level overview, Core Segments, Financials as available, Strategic Information, Market Rank/Share for key companies, Products and Services, and Recent Developments)
- 6.4.1 Amcor plc
- 6.4.2 ALPLA Group
- 6.4.3 Graham Packaging Company
- 6.4.4 Silgan Holdings Inc.
- 6.4.5 Gerresheimer AG
- 6.4.6 Greiner Packaging International GmbH
- 6.4.7 Resilux NV
- 6.4.8 Altium Packaging LLC
- 6.4.9 Retal Industries Ltd.
- 6.4.10 Nampak Ltd.
- 6.4.11 Comar LLC
- 6.4.12 Alpha Packaging Pvt. Ltd.
- 6.4.13 Plastipak Holdings Inc.
- 6.4.14 Pretium Packaging LLC
- 6.4.15 CoastPak Industrial Co. Ltd.
- 6.4.16 Grief, Inc.
- 6.4.17 O.Berk Company, LLC
- 6.4.18 Mauser Packaging Solutions Holding Company
- 6.4.19 Richards Glass Co. Ltd.
- 6.4.20 Triumbari Corp.
7 MARKET OPPORTUNITIES AND FUTURE OUTLOOK
- 7.1 White-space and Unmet-need Assessment

